A Guest post by Ovi
All of the Crude plus Condensate (C + C) production data for the US state charts comes from the EIAʼs Petroleum Supply monthly PSM.
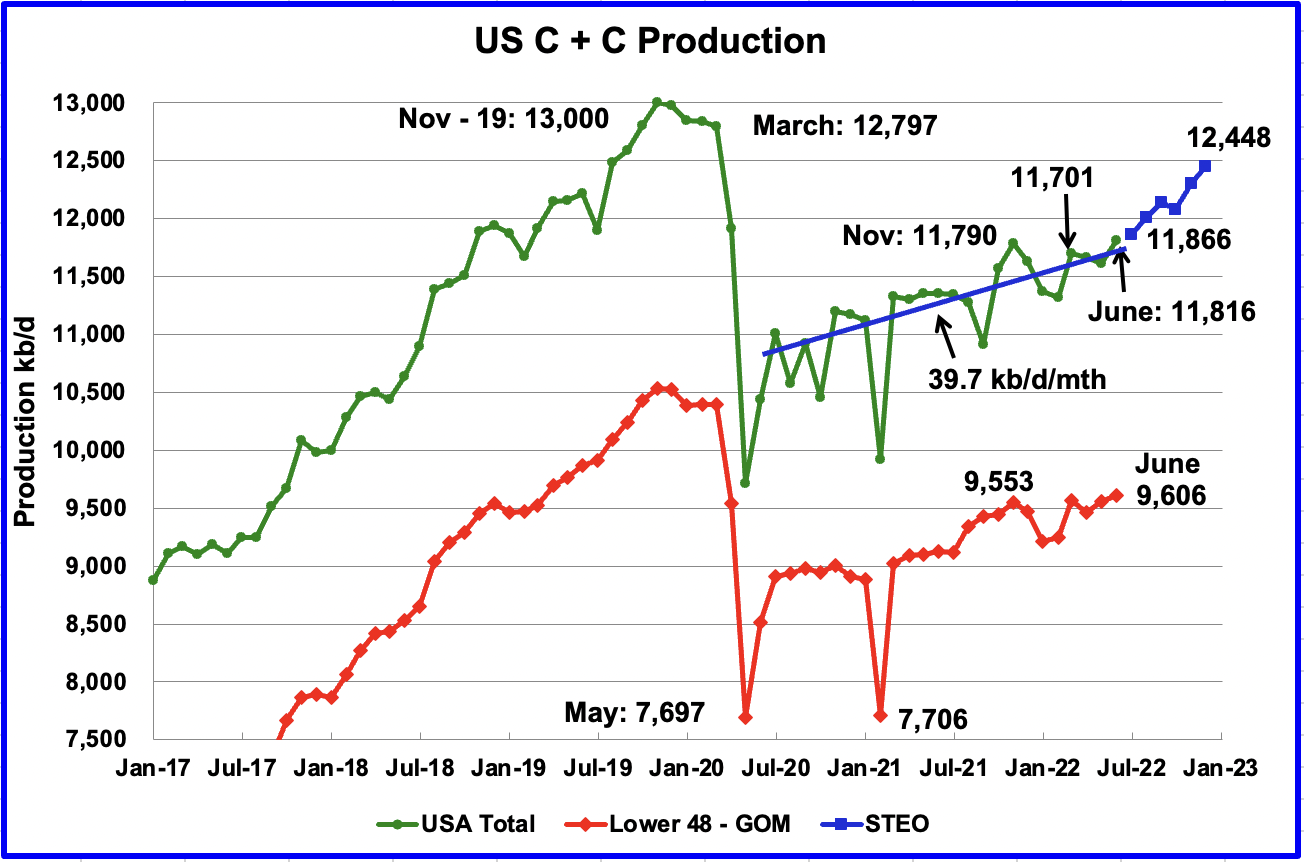
U.S. June production increased by 201 kb/d to 11,816 kb/d. Of the 201 kb/d increase, the largest increase came from the GOM, 183 kb/d. June’s production was a new recent high at 26 kb/d higher than November 2021 which was producing at a rate of 11,790 kb/d.
While overall US production increased, a clearer indication of the health of US onshore oil production can be gleaned by looking more closely at the On-shore L48 states. In the On-shore L48, June production increased by 46 kb/d to 9,606 kb/d.
The blue graph, taken from the September 2022 STEO, is the production forecast for the US from July 2022 to December 2022. Output for December 2022 is expected to be 12,448 kb/d, a decrease of 128 kb/d reported in the previous post.
From July 2022 to December 2022, production is expected to increase by 582 kb/d or at an average rate of 116.4 kb/d/mth. This rate is more than double the rate of the OLS Blue line covering US C + C production from July 2020 to June 2022. The OLS line has a production rate of 39.7 kb/d/mth. The much higher forecast production rate for the last half of 2022 could be related to an upcoming increase in GOM production. See GOM chart below.
Oil Production Ranked by State
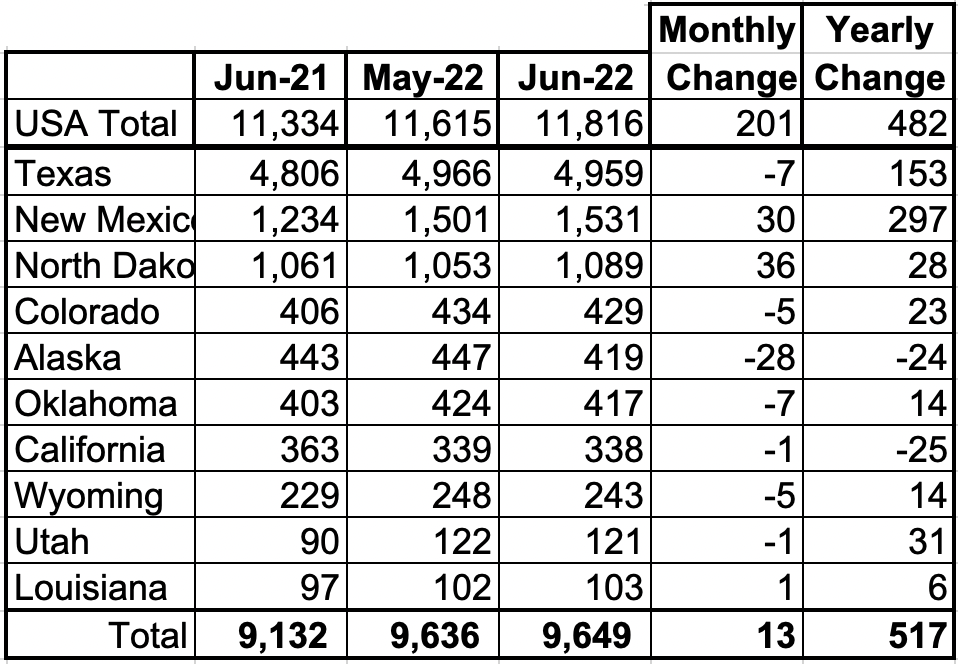
Listed above are the 10 states with the largest US production. These 10 accounted for 81.7% of all U.S. oil production out of a total production of 11,816 kb/d in June 2022.
On a YoY basis, US production increased by 482 kb/d with the majority having come from New Mexico and Texas.
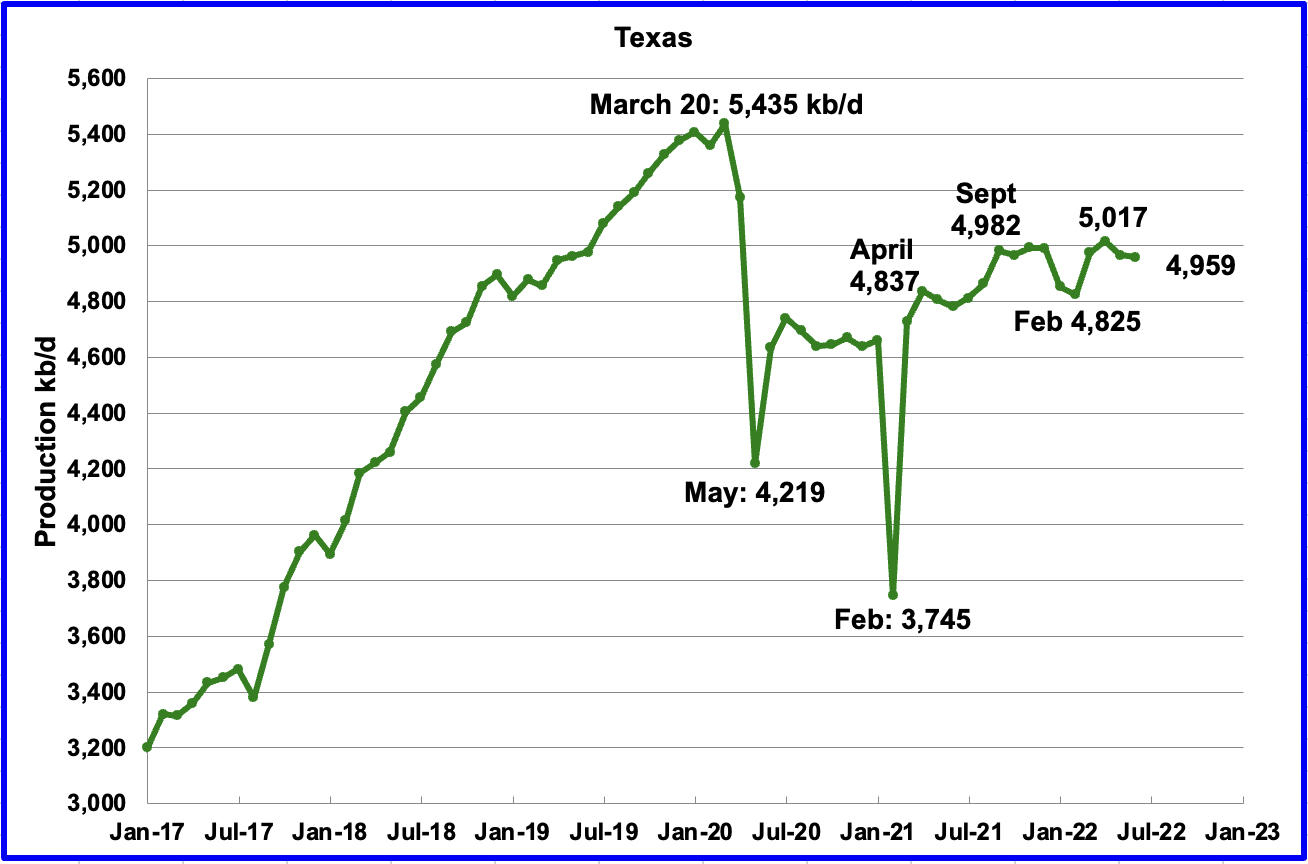
Texas production decreased by 7 kb/d in June to 4,959 kb/d from 4,966 kb/d in May.
In September 2021 there were 205 Hz oil rigs operating in Texas. By the last week of June 2022, 302 Hz oil rigs were operational, an increase of 97 rigs and production decreased from 4,982 kb/d in September 2021 to 4,959 kb/d in June, a drop of 23 kb/d over a period of nine months.
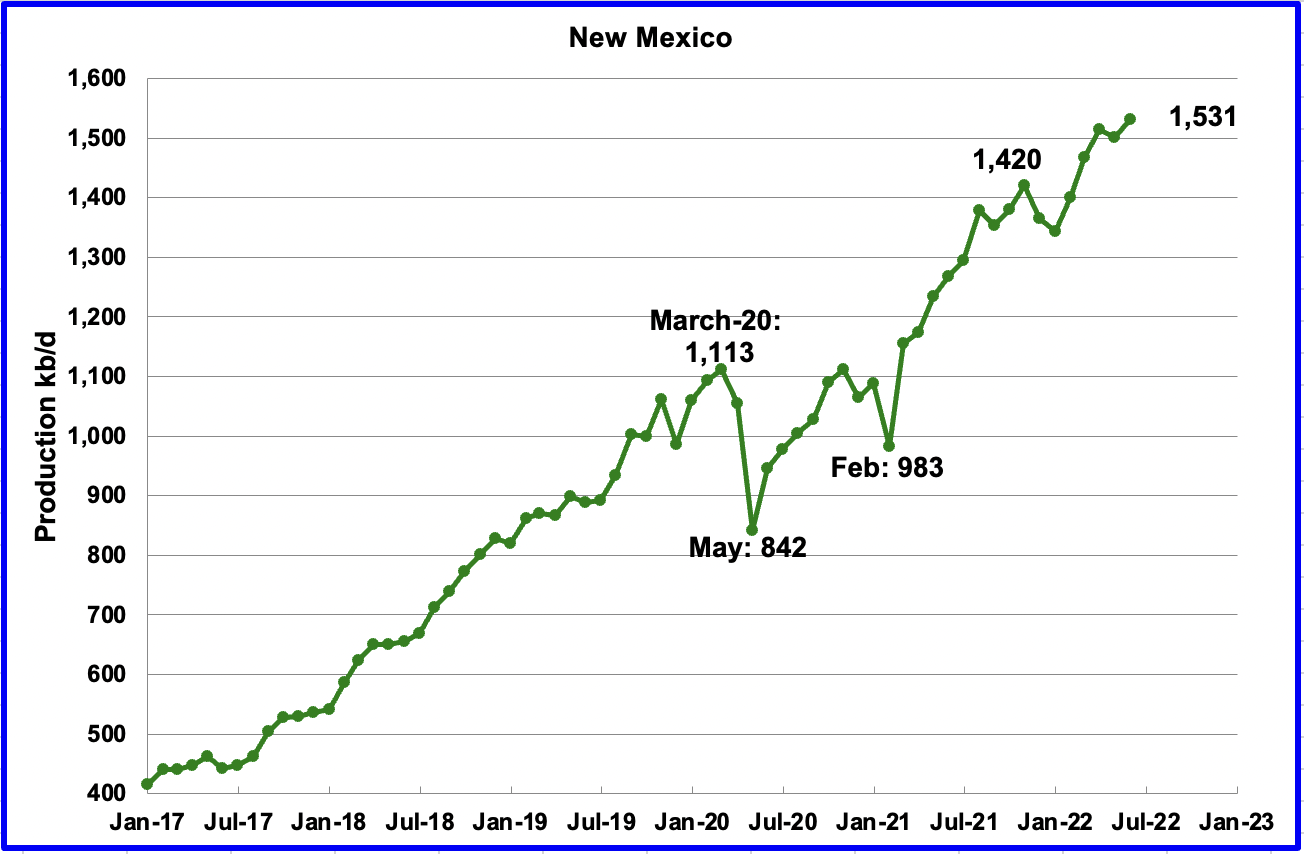
June’s New Mexico production increased by 30 kb/d to 1,531 kb/d to a new record high. From January 2022 to the end of May, close to 92 rigs were in operation in the New Mexico Permian. However in June and July operational rigs peaked at 104 and 105 respectively. The recent production increase is due to more wells being drilled and more wells being completed than drilled.
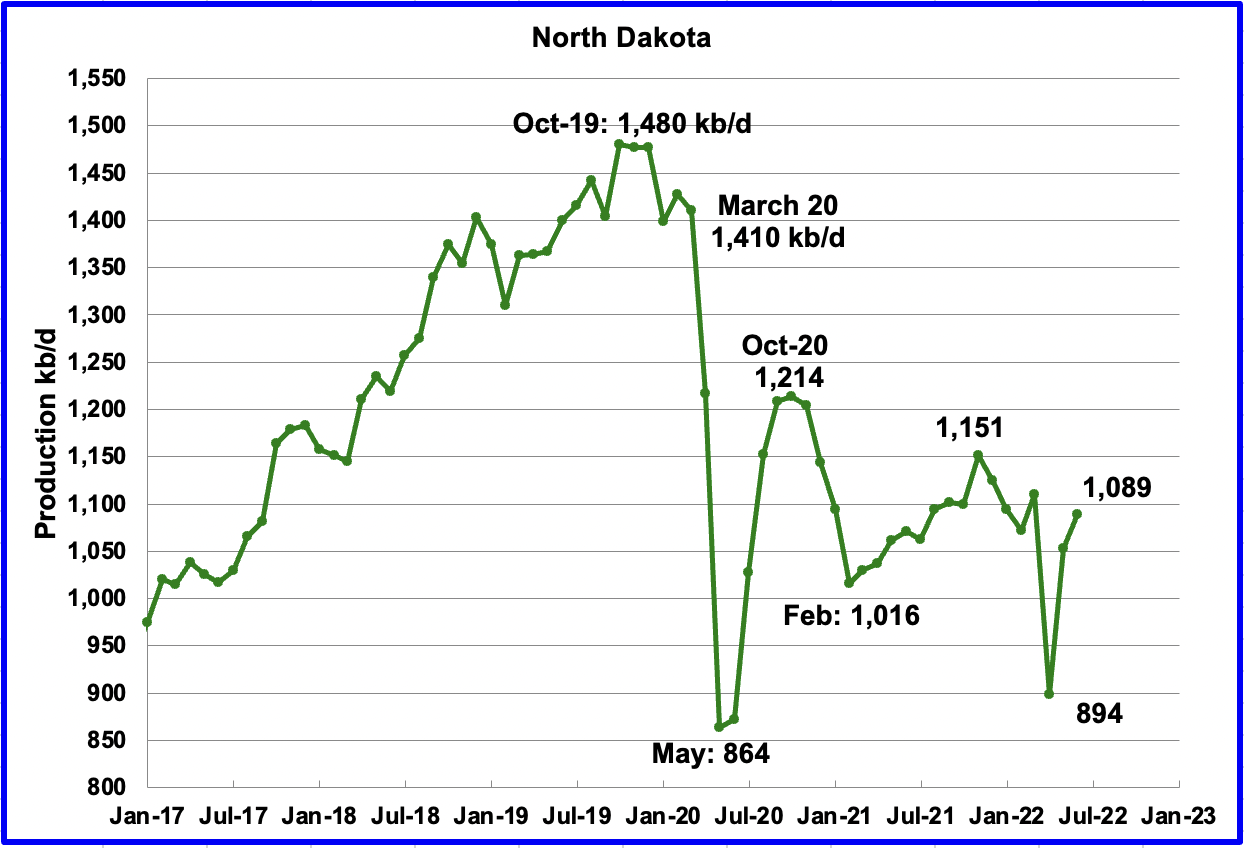
North Dakota’s June output rebounded from the April/May storm to 1,089 kb/d, an increase of 36 kb/d over May.
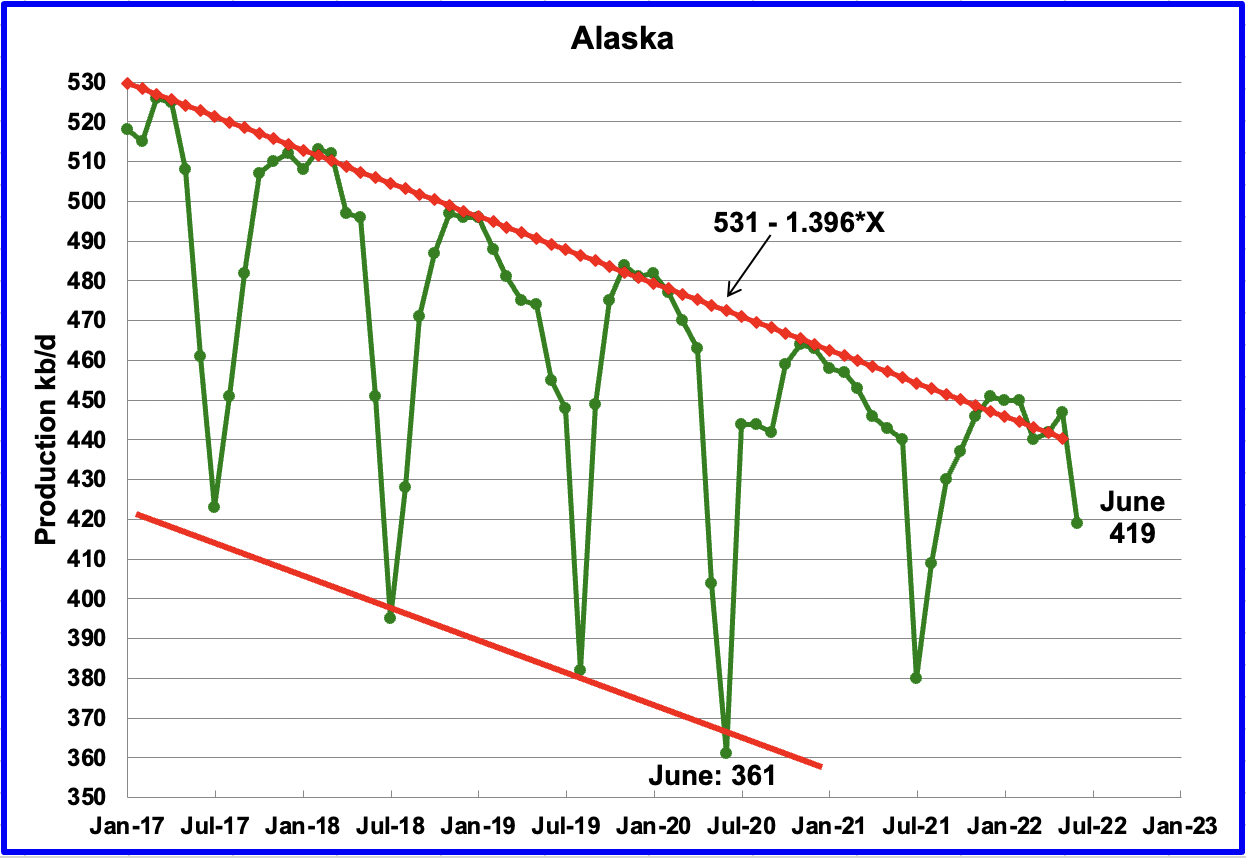
Alaskaʼs June output decreased by 28 kb/d to 419 kb/d. June production typically falls due to summer maintenance.
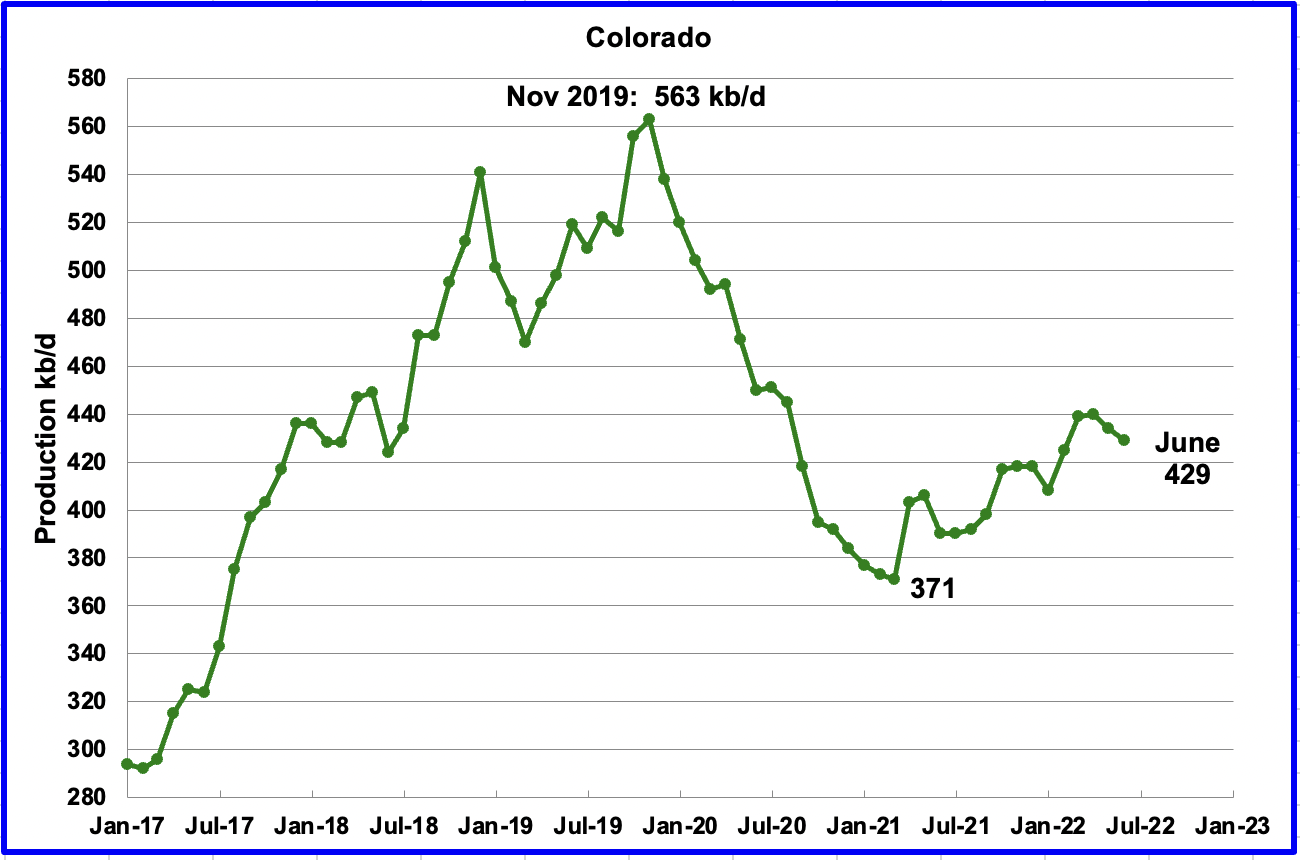
Coloradoʼs June production decreased by 5 kb/d to 429 kb/d. A recent Colorado report forecasts little oil growth is likely in Colorado for 2022.
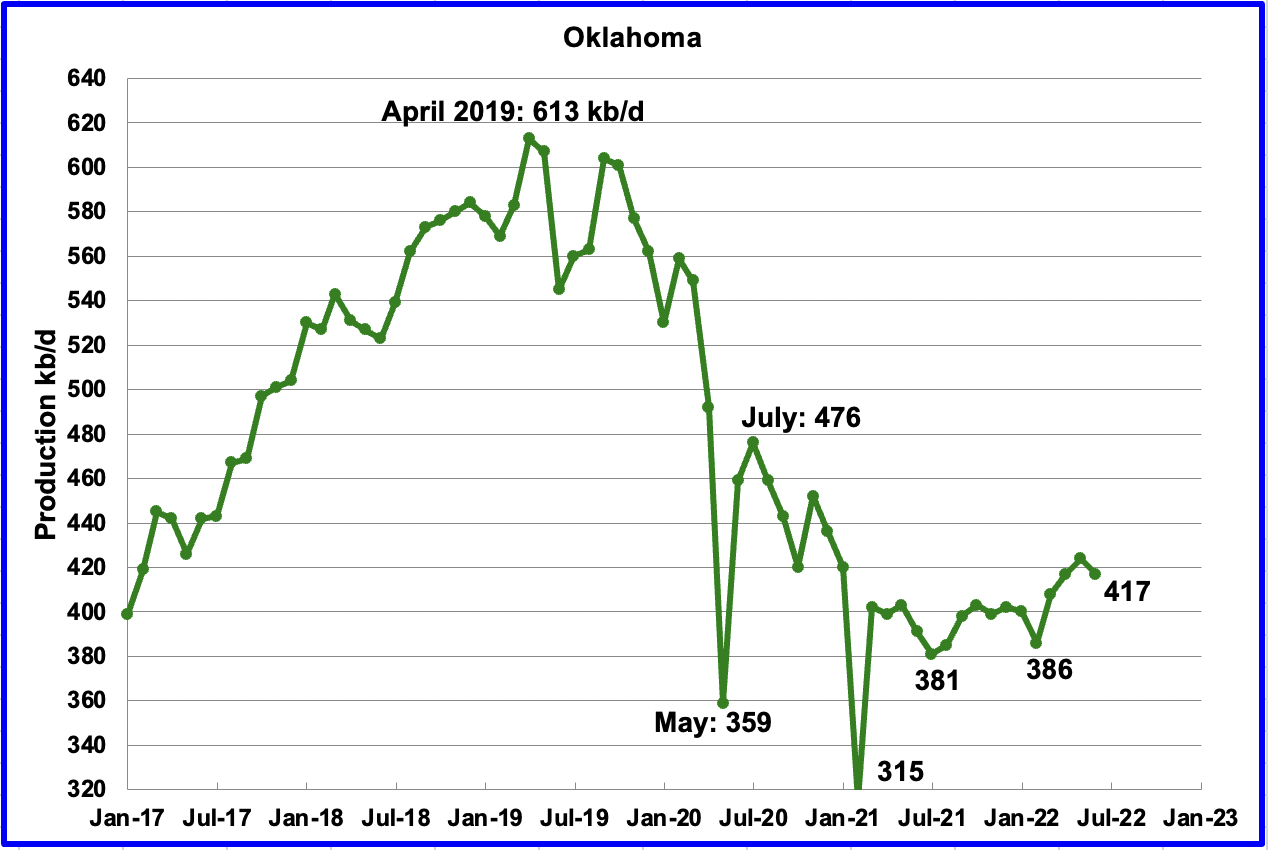
Oklahoma’s output in May decreased by 7 kb/d to 417 kb/d. From January to April, close to fifty rigs were operating in Oklahoma. In June the rig count increased to 56.
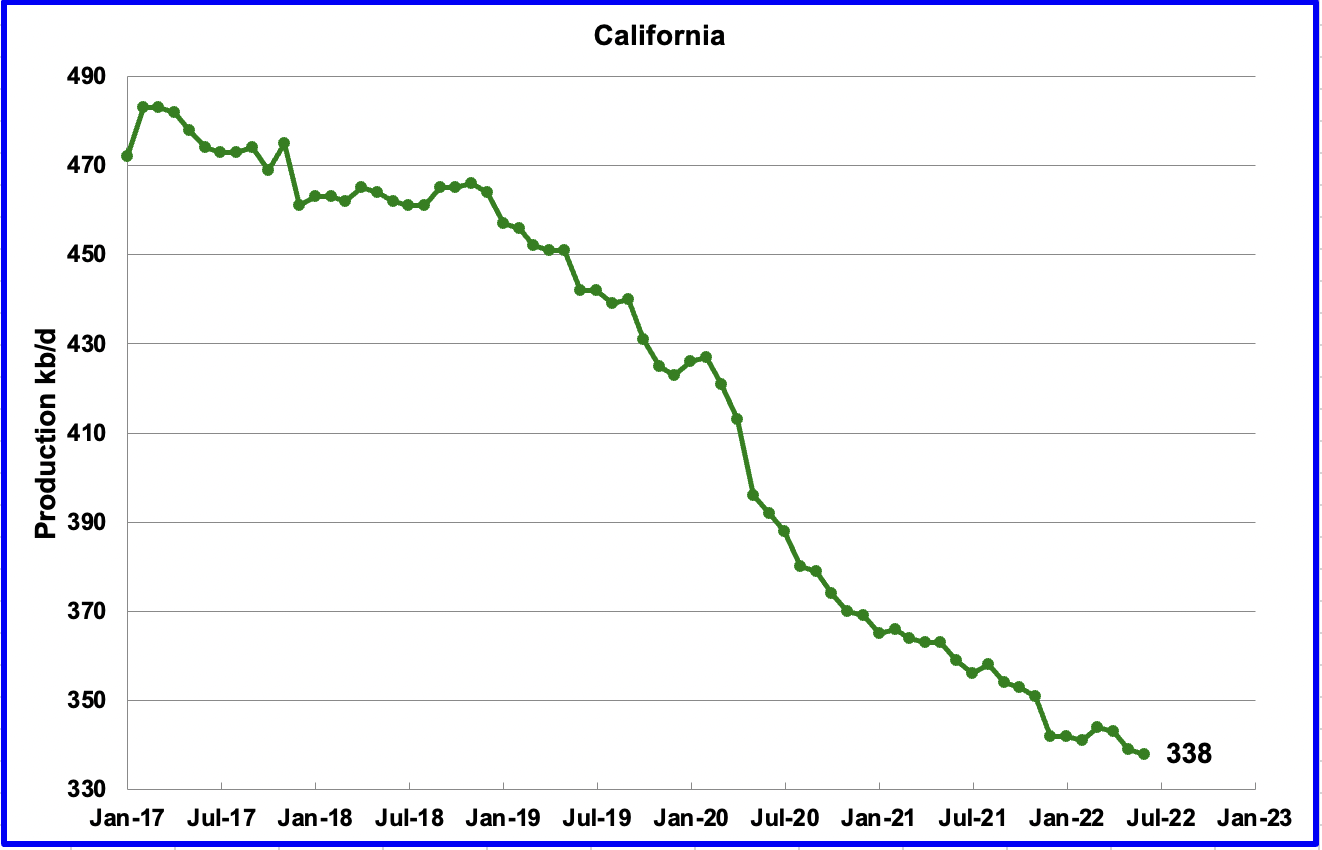
Californiaʼs slow output decline continued in June. Output decreased by 1 kb/d to 338 kb/d.
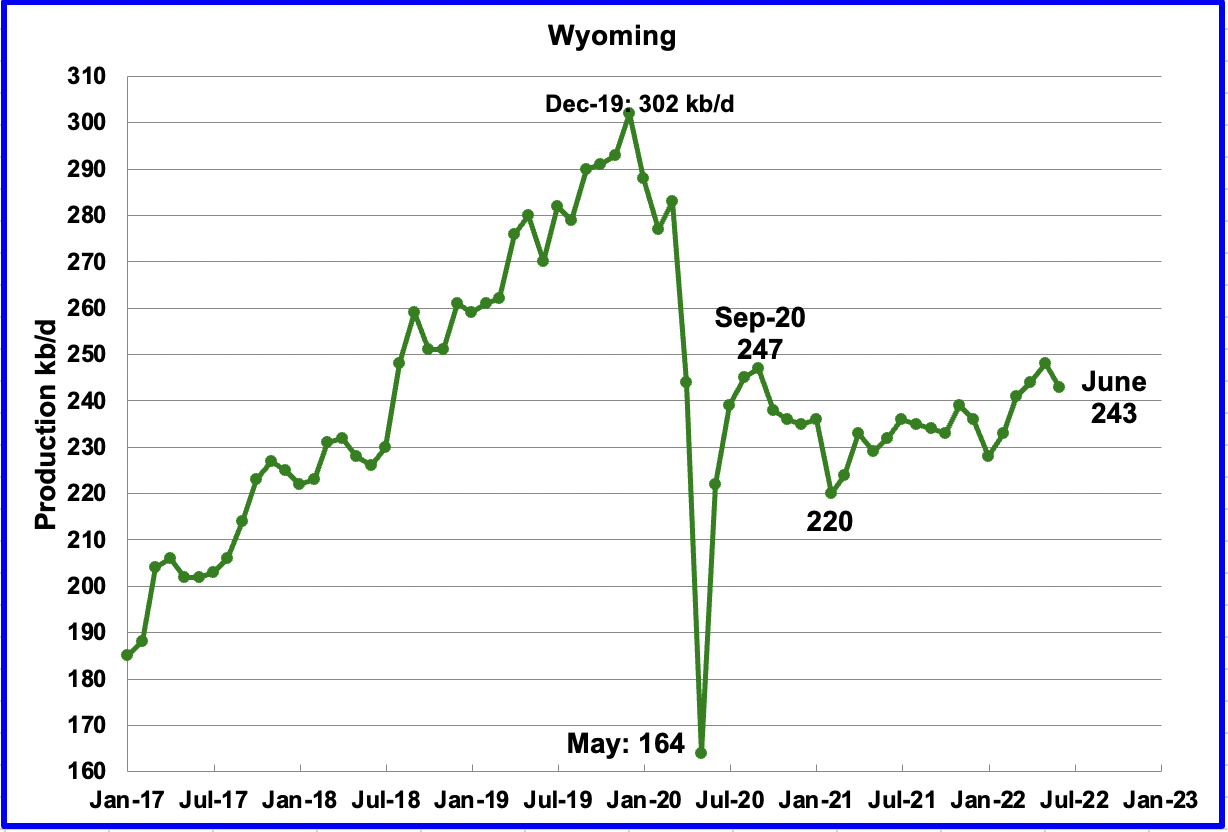
Wyoming’s oil production has been on an uptrend from the low of 220 kb/d in February 2021 due to increased drilling. June’s output decrease of 5 kb/d to 243 kb/d is the first production drop in 5 months.
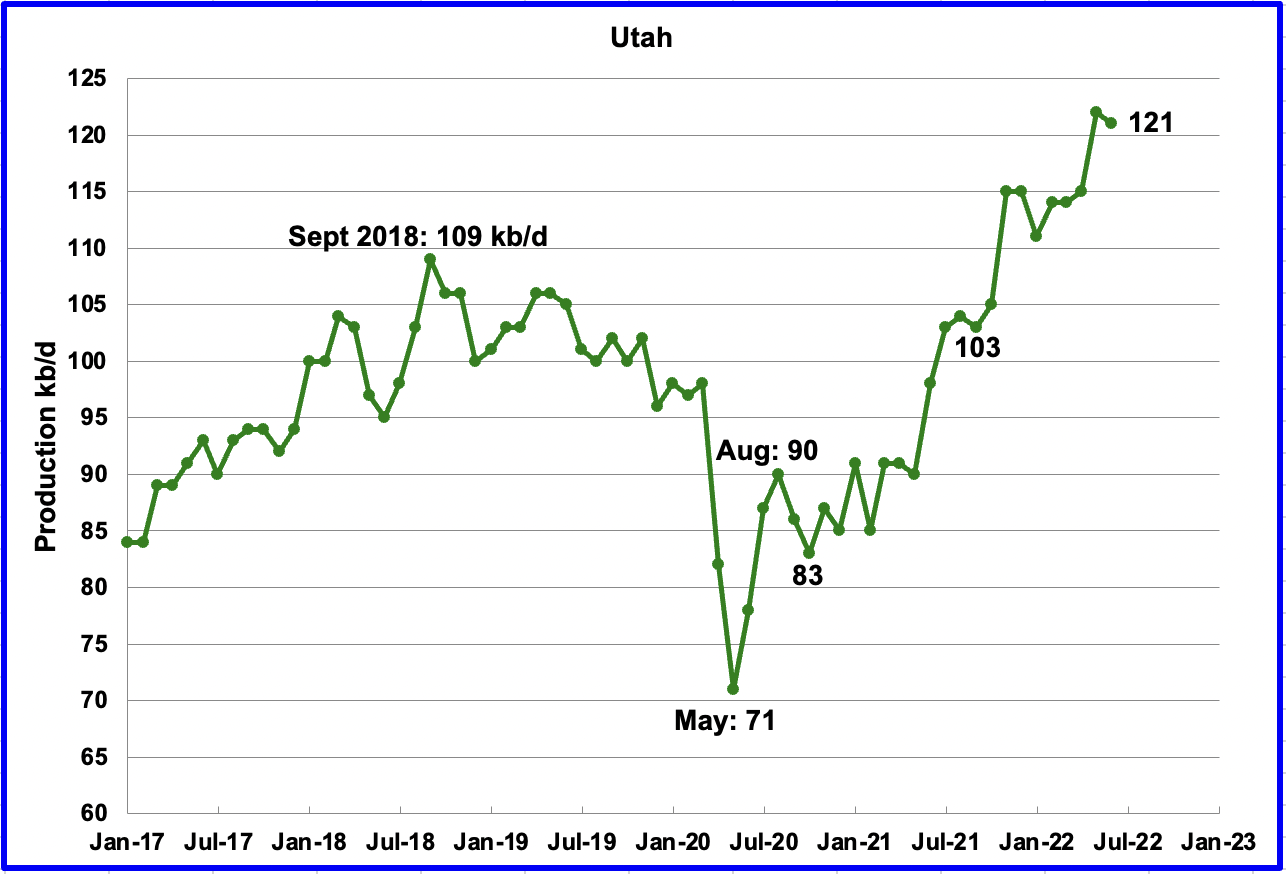
Utah’s production hit a new high in May but dropped in June. June’s production decreased by 1 kb/d to 121 kb/d. Utah had 10 rigs operating in June, an increase of 5 over January.
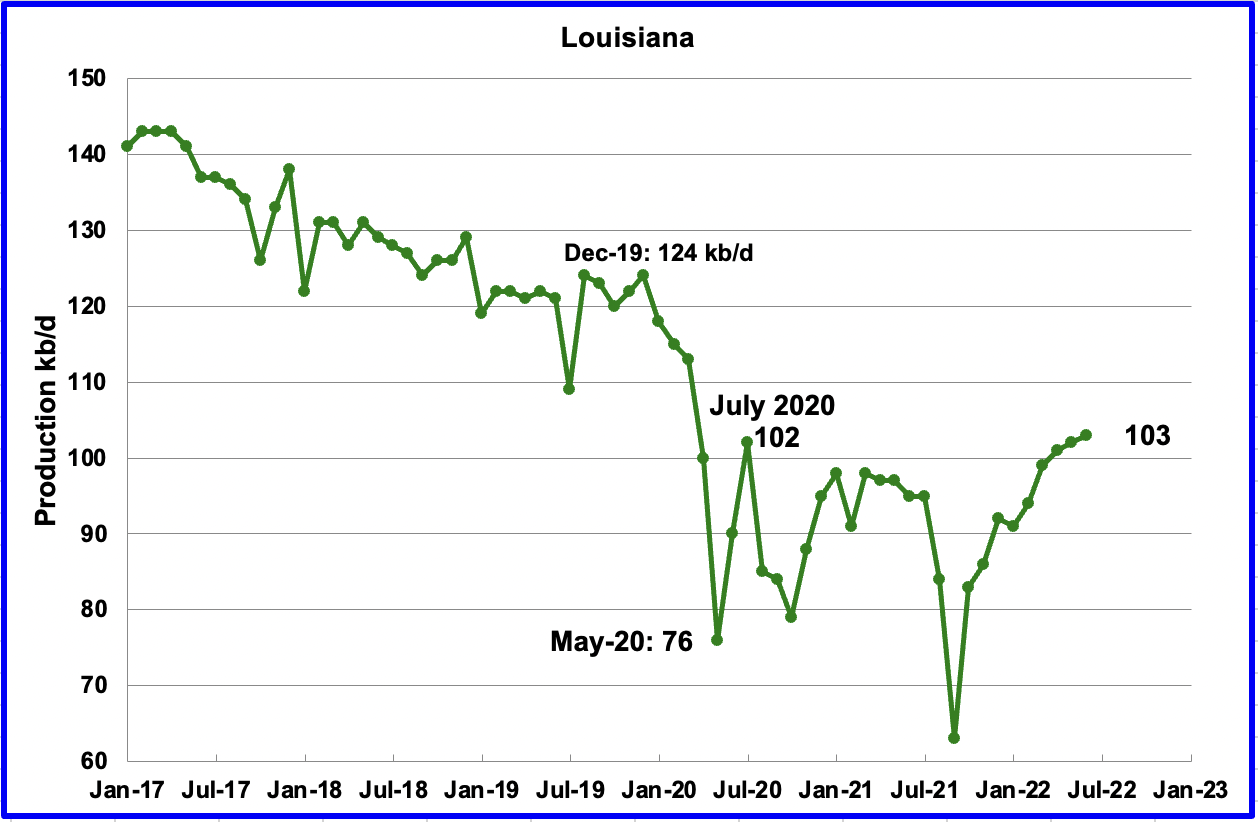
Louisiana’s output increased by 1 kb/d in June to 103 kb/d and exceeded its previous high of 102 kb/d in July 2020.
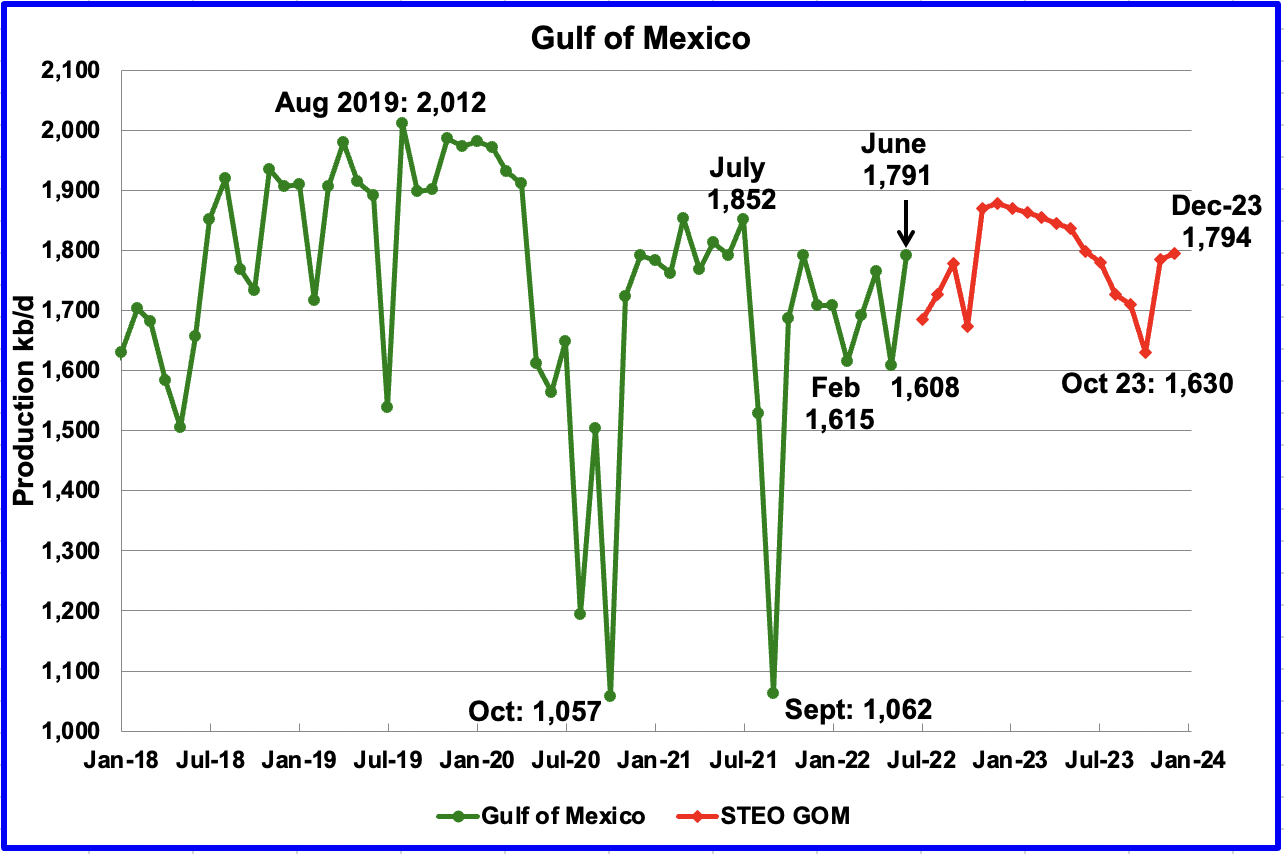
The GOM production is at highest level since July 2021. GOM production rebounded by 183 kb/d to 1,791 kb/d in June after restoring shut in production caused by bad weather. If the GOM was a state, its production would normally rank second behind Texas.
According to one of our contributors, Bob Meltz, the impact of King’s Quay first oil and Thunderhorse South may be responsible for the rebound. August will be somewhat lower because of pipeline issues with Shell’s Mars-Ursa fields. GOM still has Mad Dog 2 and Vito to come online over the next 6 months or so.
The August 2022 STEO projection for the GOM output has been added to this chart and projects output will be 1,794 kb/d in December 2023. For July 2022, the STEO is projecting a drop of 107 kb/d to 1,684 kb/d.
A Different Perspective on US Oil Production
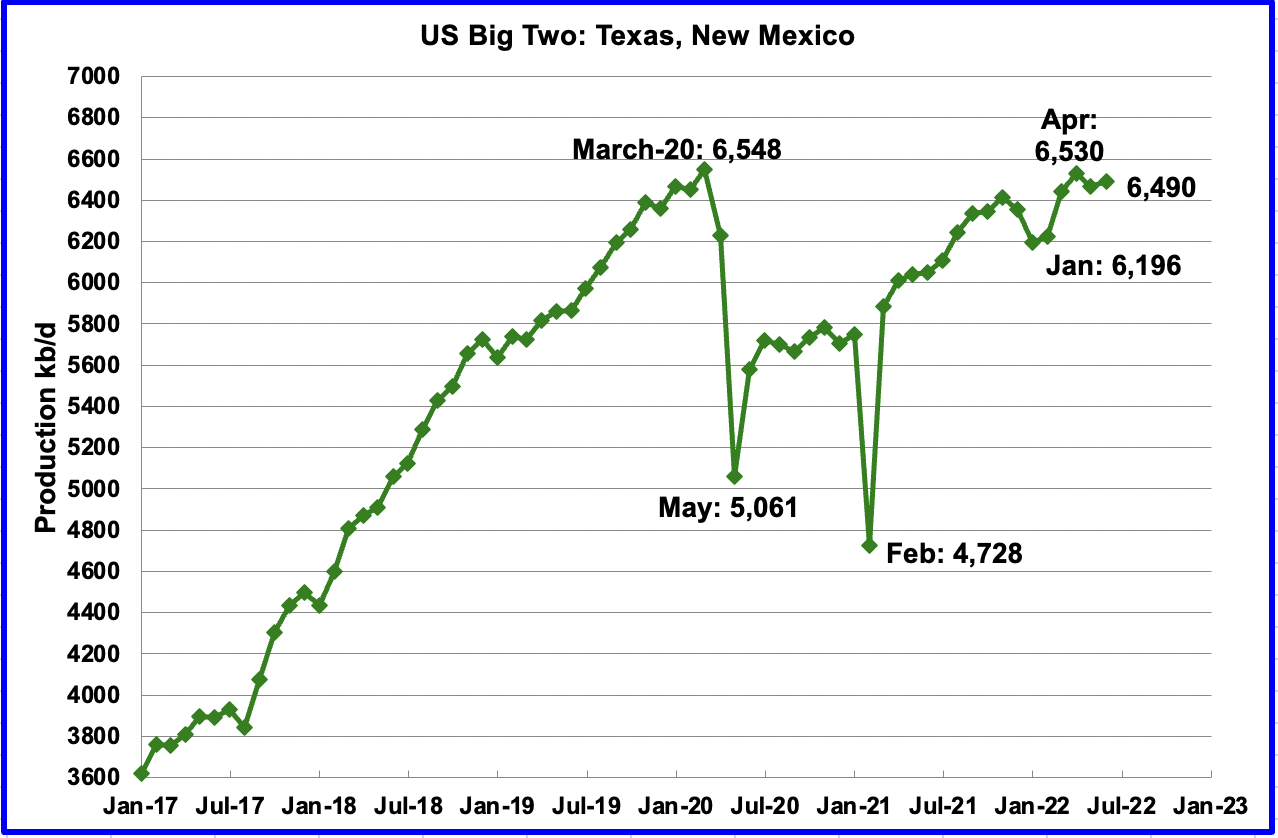
The Big Two states, combined oil output for Texas and New Mexico.
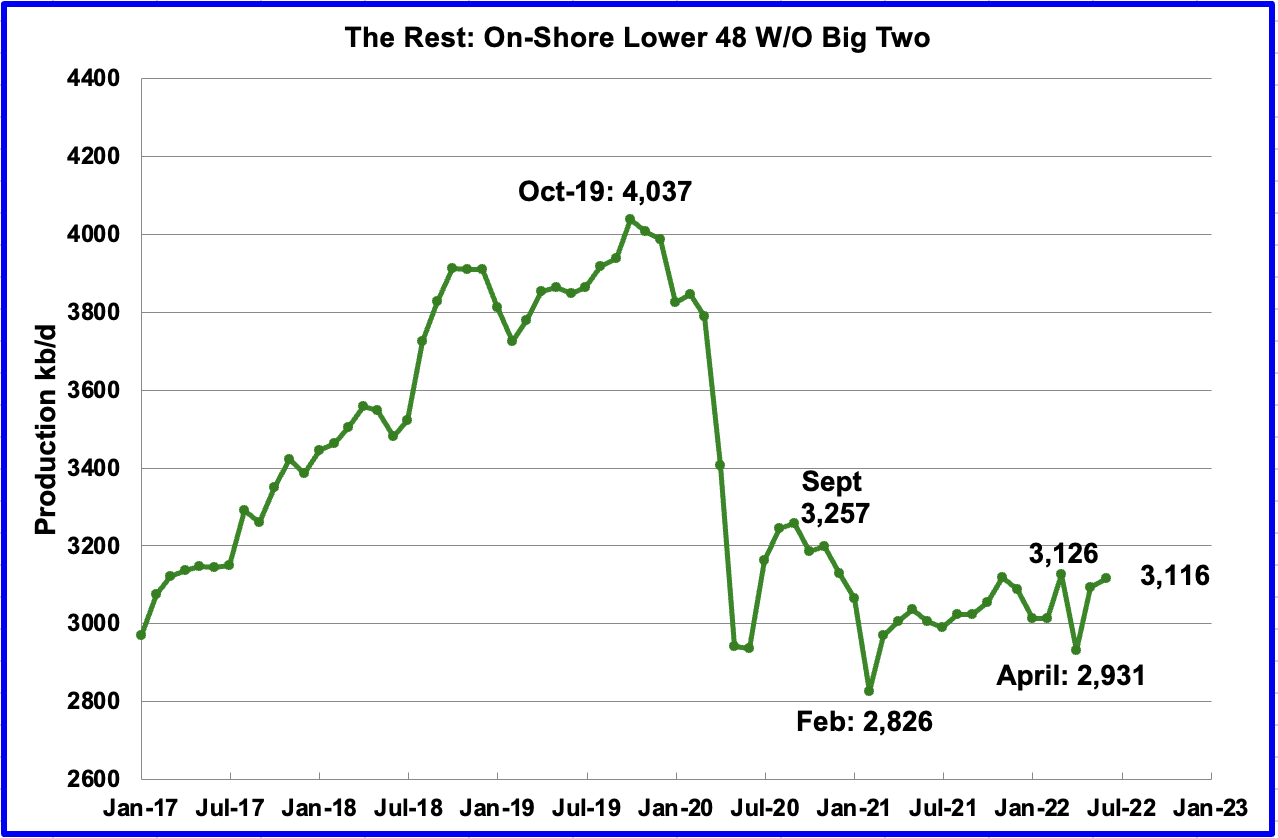
Oil production for The Rest
To get a different perspective on US oil production, the above two charts have segregated US state production into two groups, “The Big Two” and the “On-Shore L48 W/O Big Two” or The Rest.
June’s production increased in the Big Two states by a combined 23 kb/d, with Texas dropping 7 kb/d and New Mexico adding 30 kb/d.
Over the past year, production in The Rest appears to be holding steady at close to 3,100 kb/d. In June The Rest added 23 kb/d.
Rigs and Fracs
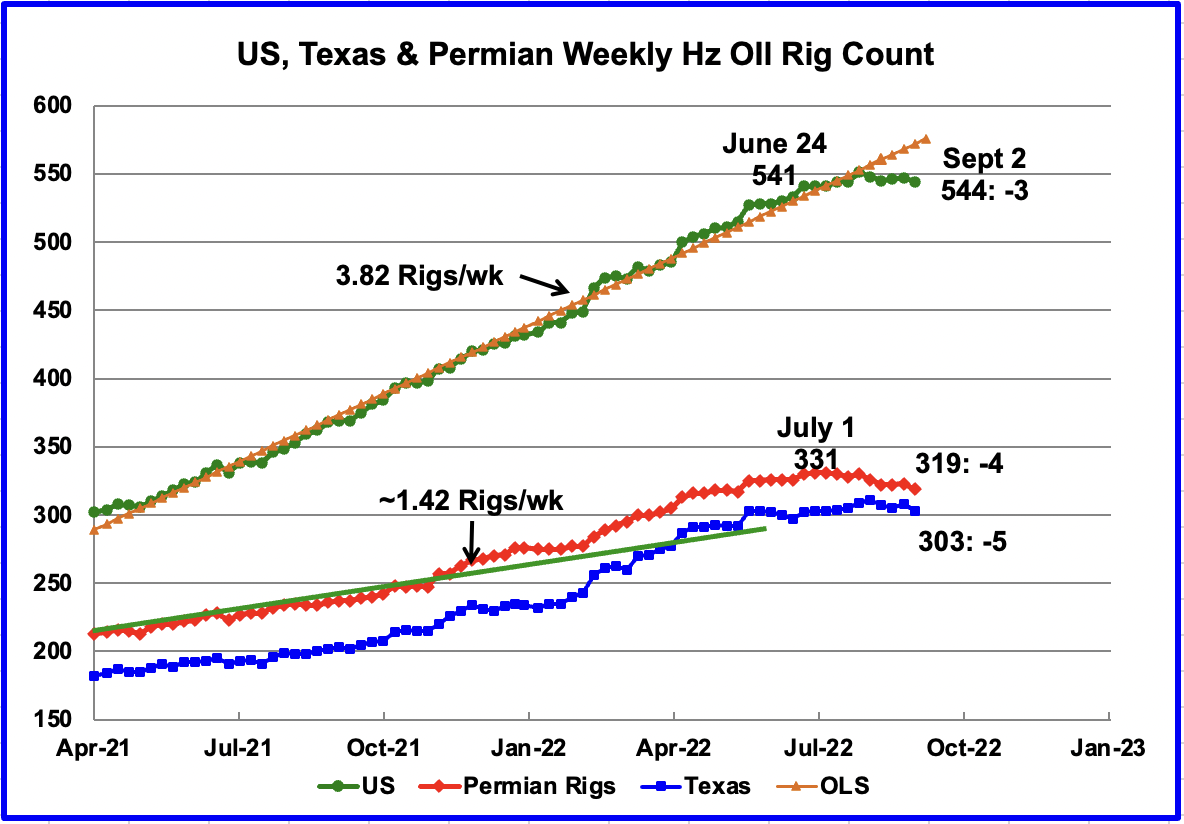
Since the beginning of April 2021 through to the week ending July 29, 2022, the US has been adding horizontal oil rigs at a rate of close to 3.82 rigs/wk, orange OLS line, and peaked at 551 rigs in the week ending July 29. However since then, the number of operational rigs has declined by 7 to 544 in the week ending September 2.
In the Permian, the rig count peaked at 331 in the week ending July 1 and has dropped by 12 to 319 in the week ending September 2. Can the drop of 12 Rigs over the last two months in the Permian be related to the recent price drop in WTI, equipment shortage or fewer/declining Tier 1 drilling spots or all of the above?
In Texas 303 rigs were operational, a decrease of 5 over the previous week and down 8 from the peak of 311 in Early August.
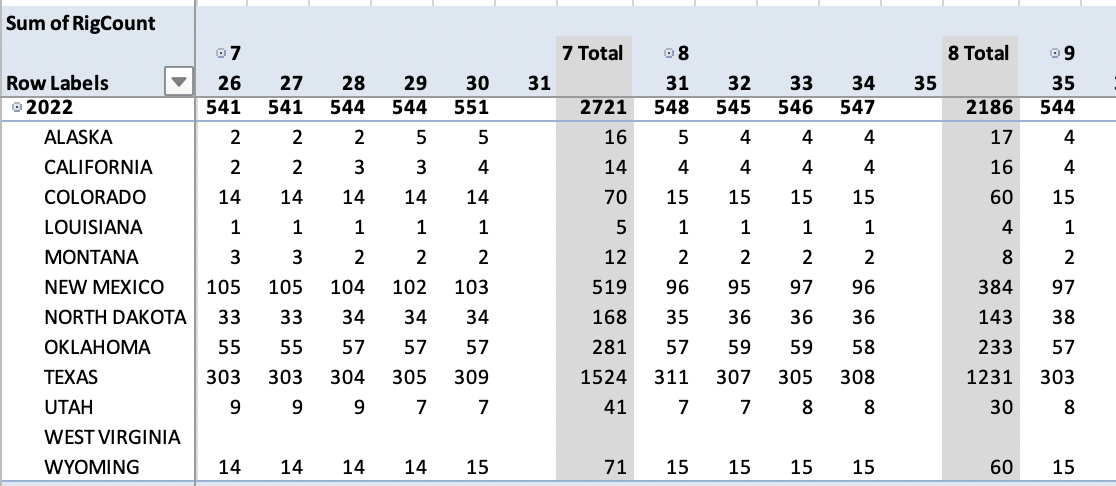
This table shows the trend in rig growth starting in the first week of July and ending in the first week of September. Comparing the first and last columns, the largest changes have occurred in New Mexico and North Dakota. New Mexico is down 8 while North Dakota is up 5.
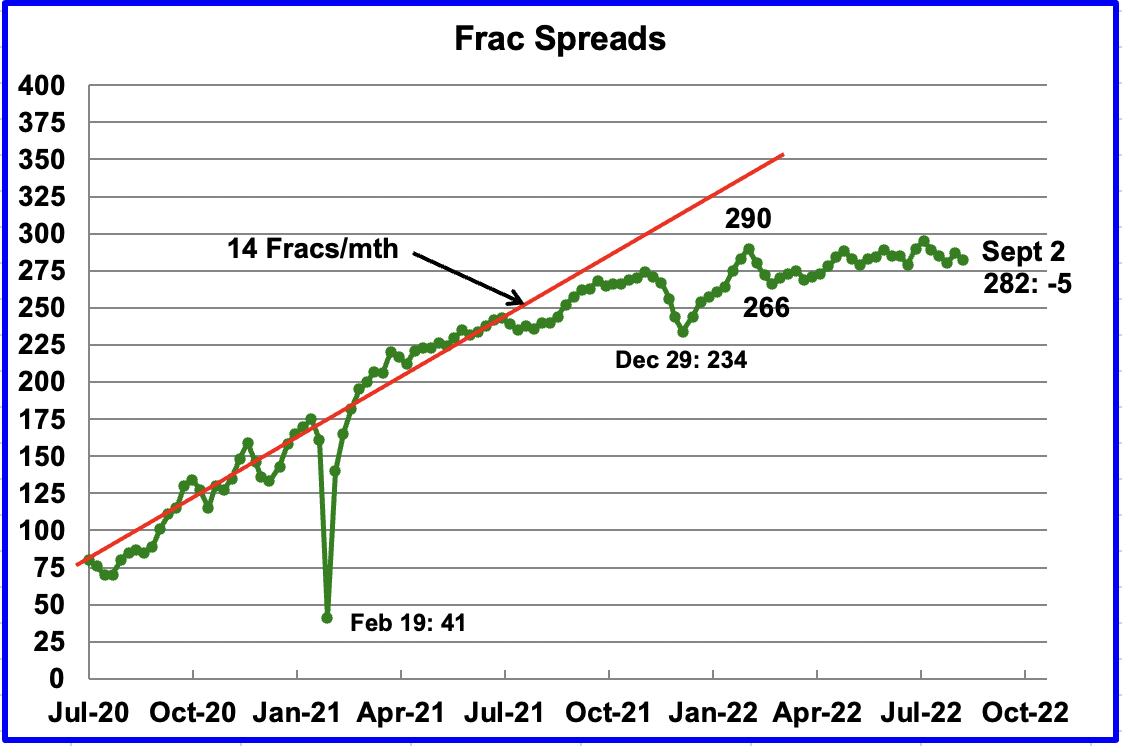
Over the last 5 weeks ending September 2, the frac spread count and the US rig count have both declined. Frac spreads have dropped from 295 in the week of July 29 to 282 in the first week of September. Over the same period, the US Hz rig count dropped from 551 to 544.
Since early February, the growth in frac spreads has not been keeping pace with the growth in rigs. In the week ending September 2, 282 frac spreads were operating, 8 fewer than the 290 operating in the week ending February 25. From February to late July, the rig count increased from 475 to 545, after which both started to decline.
What is causing the the frac spread count to drop?
Note that these 282 frac spreads include both gas and oil spreads.