By Ovi
All of the Crude plus Condensate (C + C) production data, oil, for the US state charts comes from the EIAʼs Petroleum Supply monthly PSM which provides updated information up to March 2023.
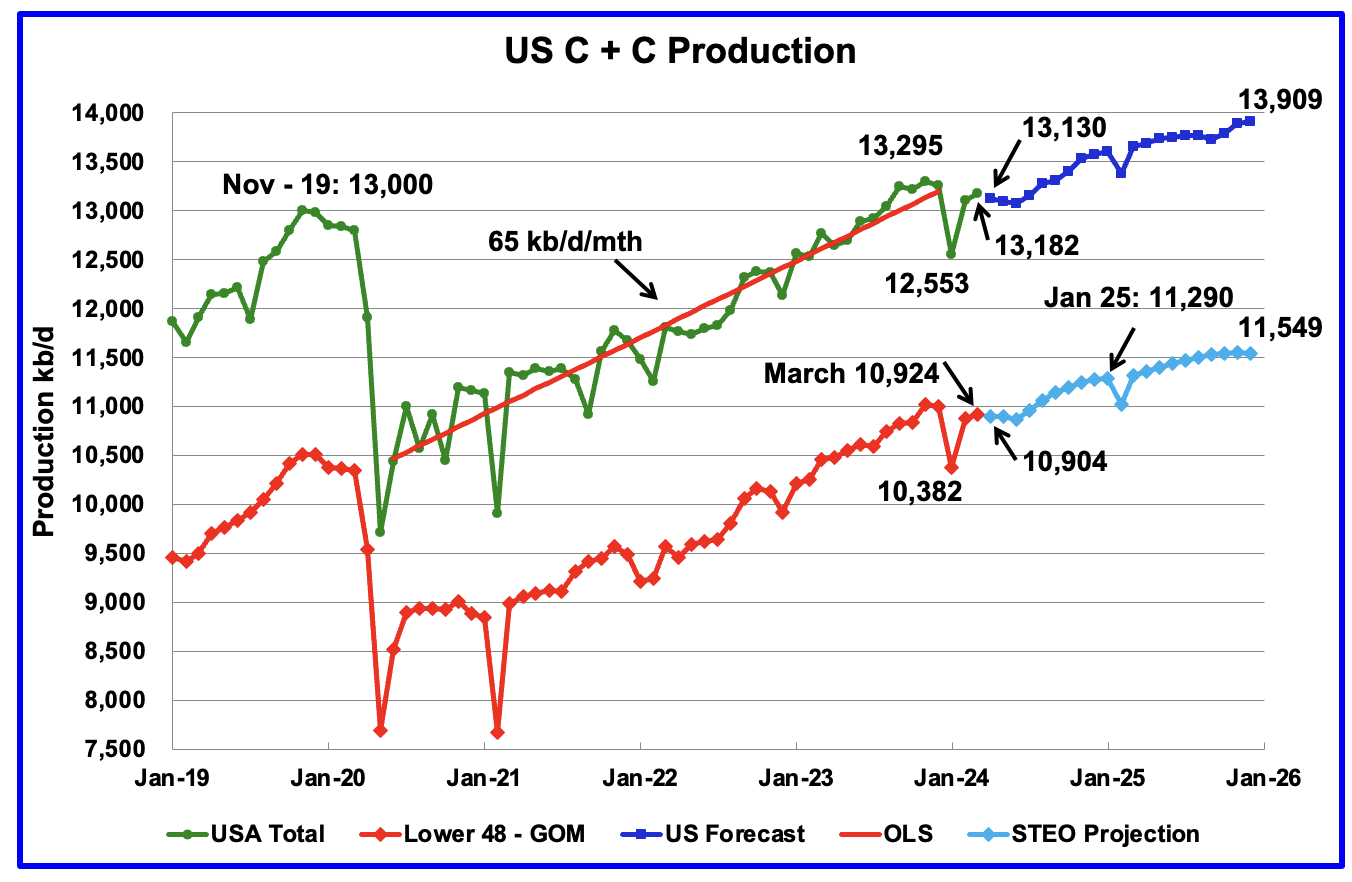
U.S. March oil production rose by 77 kb/d to 13,182 kb/d. The largest increases came from Texas, 36 kb/d and New Mexico, 32 kb/d. However relative to the EIA’s February production report, which was revised down from 13,154 kb/d to 13,105 kb/d, March production is up by 18 kb/d.
US production has been flat since September 2023.
The dark blue graph, taken from the May 2023 STEO, is the forecast for U.S. oil production from April 2024 to December 2025. Output for December 2025 is expected to reach 13,905 kb/d and is an increase of 5 kb/d from the previous STEO report. From March 2024 to December 2025 production is expected to grow by 779 kb/d. This increase is a very high growth and is not consistent with many articles predicting a near term peak in US oil production. Will the current price drop in WTI affect the next EIA’s STEO report?
The red OLS line from June 2020 to December 2023 indicates a monthly production growth rate of 65 kb/d/mth or 780 kb/d/yr. Production going forward is increasing at a slower rate.
The light blue graph is the STEO’s projection for output to December 2025 for the Onshore L48. From March 2024 to December 2025, production is expected to increase by 625 kb/d to 11,549 kb/d which is 65 kb/d higher than reported in the previous STEO.
Is the slow rollover in production shown in the last four months of 2025 in the Onshore L48 pointing to peak US production occurring in late 2025?
US Oil Production Ranked by State

Listed above are the 11 US states with the largest oil production along with the Gulf of Mexico. Ohio has been added to this table since its production approached 100 kb/d in January and exceeded Louisiana’s production. These 11 states accounted for 83.8% of all U.S. oil production out of a total production of 13,182 kb/d in March 2024.
On a YoY basis, US production increased by 412 kb/d. GOM production rose by 30 kb/d MoM while YoY it is down by 51 kb/d.
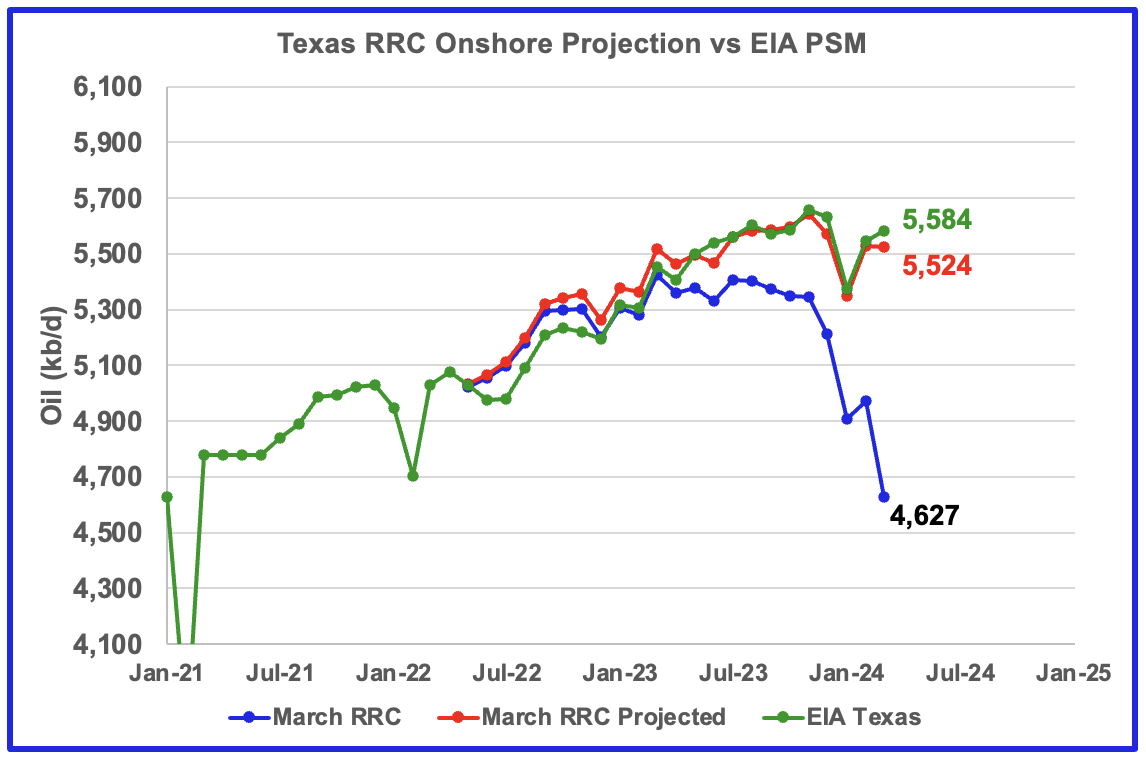
Texas production increased by 36 kb/d in March to 5,584 kb/d. YoY production is up by 130 kb/d.
The red graph is a production projection for Texas using the Texas RRC reported March production, blue graph. The projection used the difference between the March and February preliminary production data provided by the Texas RRC. The projection provides a reasonable estimate for Texas March production but is low by 1%.
It is interesting to note that February’s daily production increase of 175 kb/d was smaller than January’s drop of 258 kb/d. Could this be related to the lack of drilling or completions during those 10 freezing days in January while the rapid decline in LTO producing wells continued and is difficult to make up?
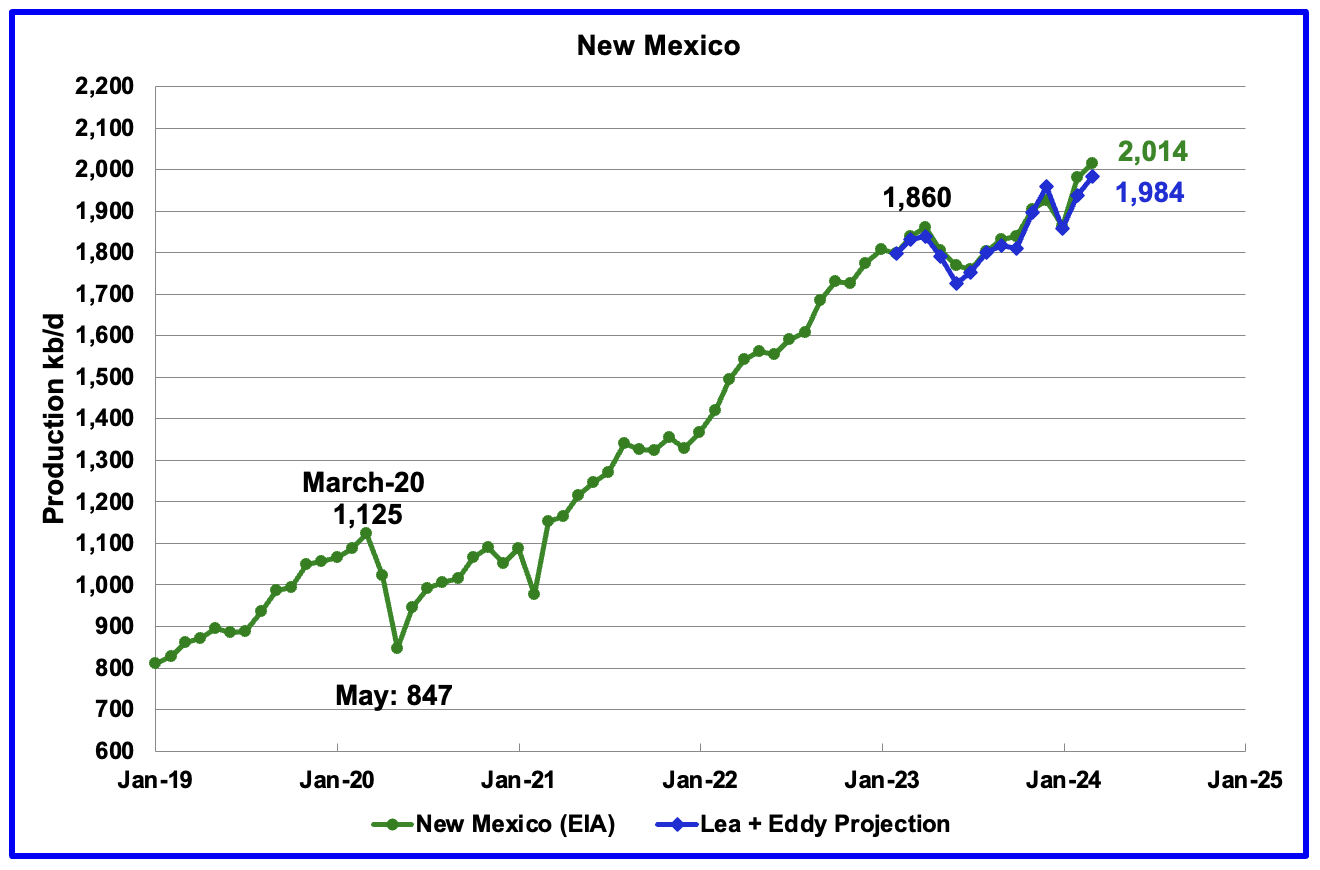
According to the EIA, New Mexico’s March production rose by 32 kb/d to a record high 2,014 kb/d.
The blue graph is a production projection for Lea plus Eddy counties since these two counties account for 98.5% of New Mexico’s oil production. The projection used the difference between February and March preliminary production data provided by the New Mexico Oil Conservation Division. The projection provides a reasonable estimate for New Mexico’s March production. A 1.5% correction was added to the Lea plus Eddy projection to account for their fraction of New Mexico production.
More oil production information from these two counties is reviewed in the special Permian section further down.
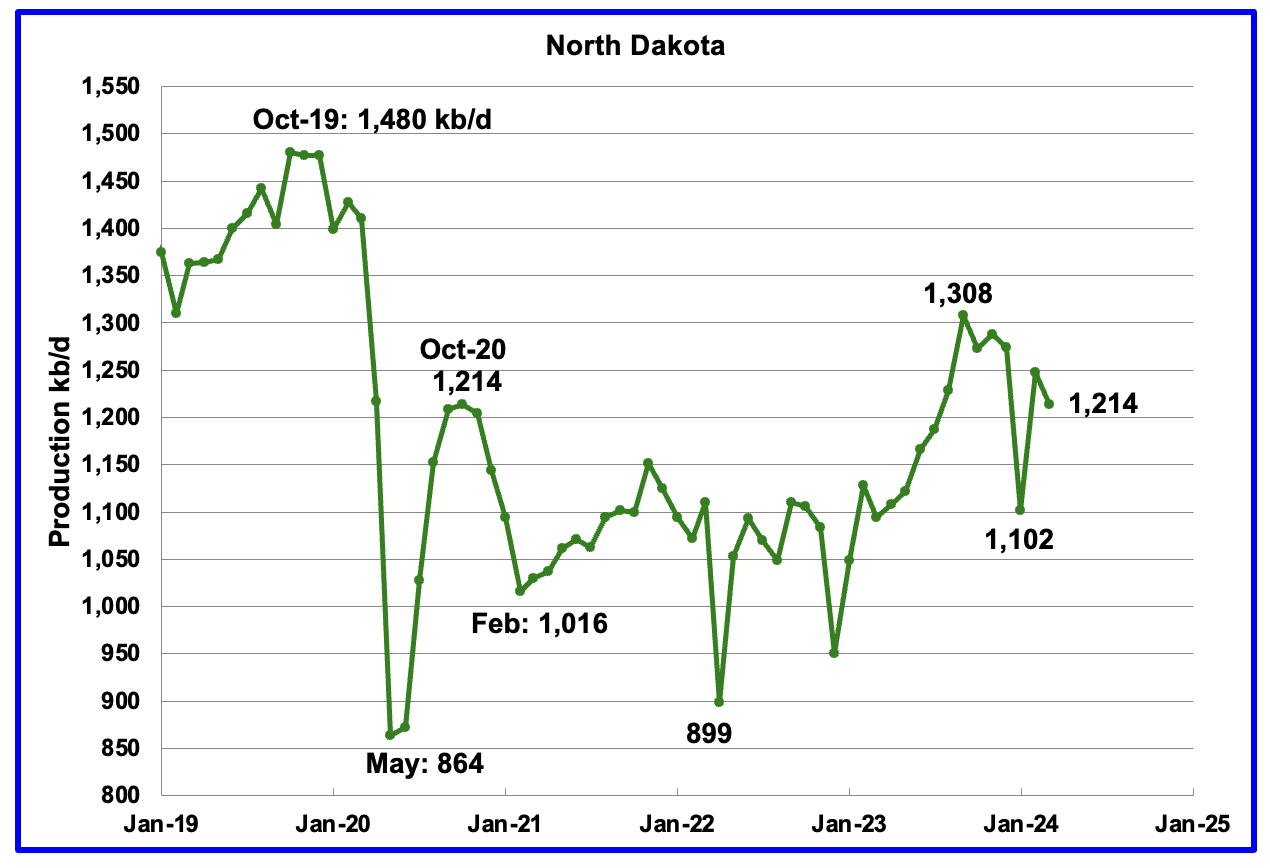
March’s output dropped by 34 kb/d to 1,214 kb/d. YoY production increased by 120 kb/d.
According to this article North Dakota’s March oil production dropped about two percent from February due to inclement weather.
“The state produced just over 1.2 million barrels per day on average.“
“We had severe winter weather that first week of March,” said North Dakota Mineral Resources director Lynn Helms. He said one of the natural gas plants — Bear Creek — went down because of power interruptions.
“We had a not of wells off,” Helms said.
Helms said March production did finish strong.
“We’re still anticipating that 1.3 million barrels per day,” Helms said. “It just seems like — month after month, we’ve had something happen.”
Helms said one bright spot was a significant increase in production in McLean County
“A well-pad with four wells, three-mile laterals, drilled by Oasis, that were brought on in December,” Helms said. “That almost doubled the McLean County production.”
It will be a difficult challenge for North Dakota to get to Helms’ 1.3 million barrels per day goal.
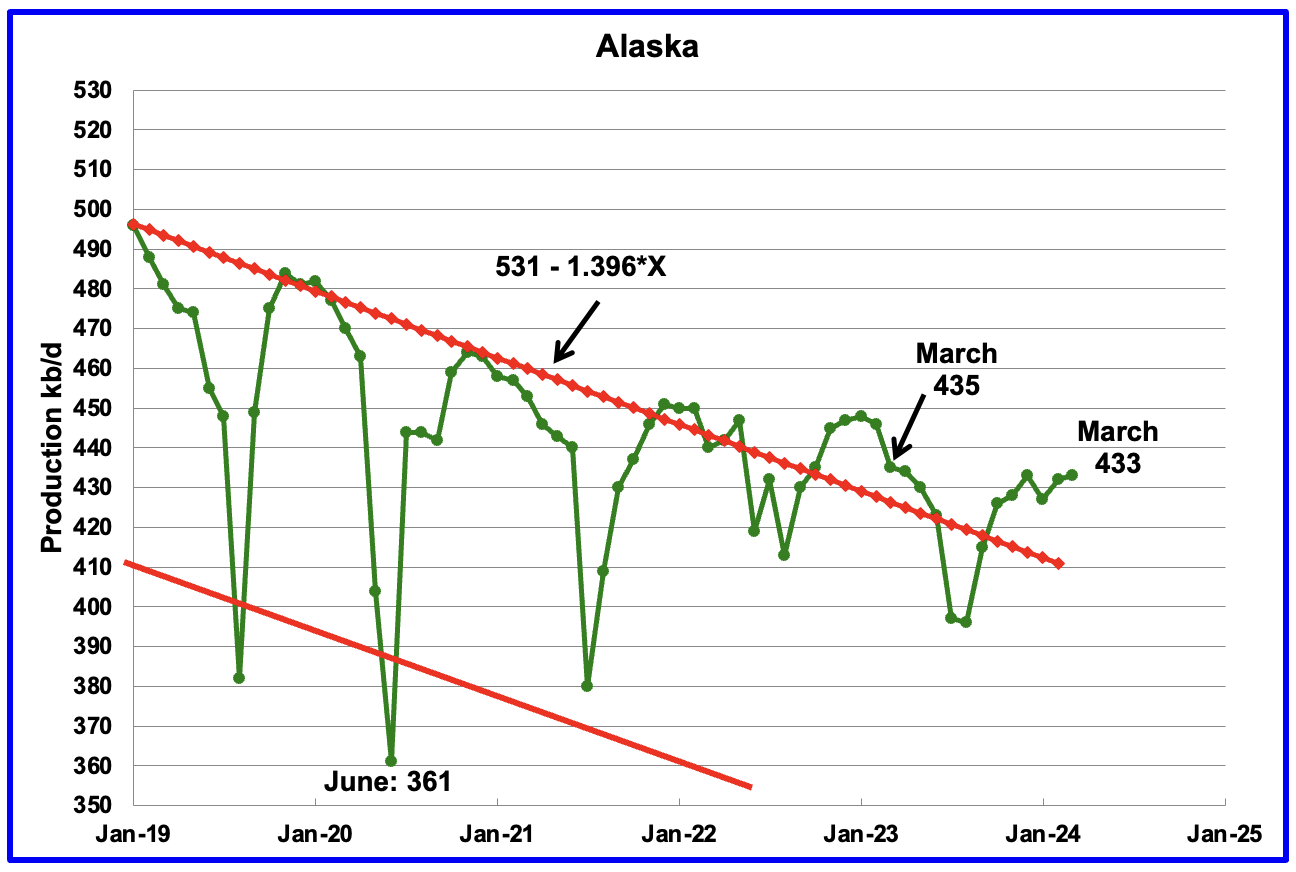
Alaskaʼs March output rose by 1 kb/d to 433 kb/d. Production YoY is down by 2 kb/d. The EIA’s weekly petroleum report continues to show Alaska’s oil production is dropping and May production is closer to 420 kb/d.
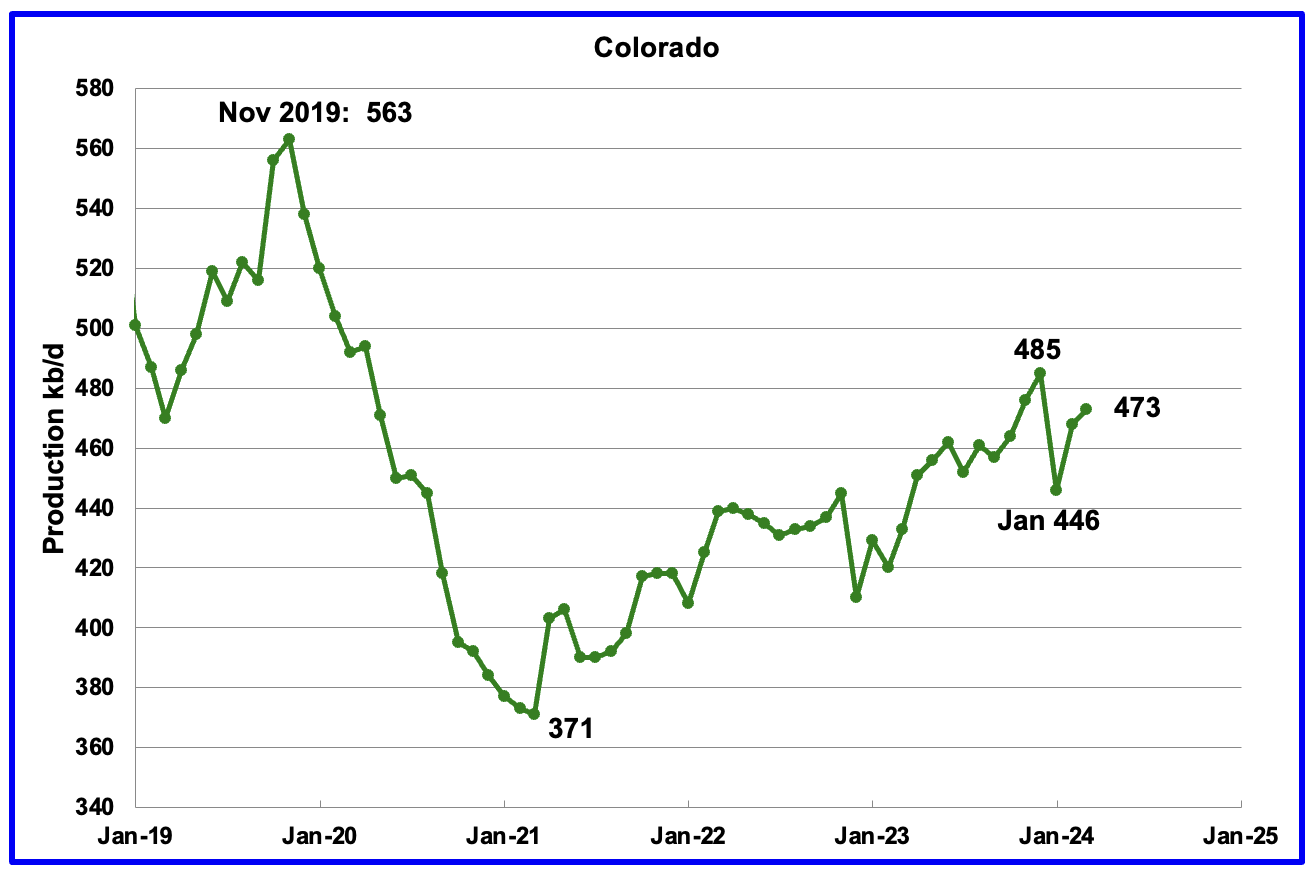
Coloradoʼs March production increased by 5 kb/d to 473 kb/d. Colorado has moved ahead of Alaska to become the 4th largest US oil producing state. Colorado began the year with 12 rigs but has now dropped to 9 during May.
Colorado’s oil producers are bracing for a new fee associated with their production as part of a compromise the industry reached with environmental groups that were pushing for more stringent regulations on drilling.
Colorado, the fourth largest oil producing state in the U.S., is a frequent battleground for the oil industry and environmentalists, who over the years have pushed for tougher regulations on fossil fuel production.
According to this article Colorado could jump-start a national push to ban new oil wells?
Colorado is weighing a major shift in its oil and gas policy, spurring a debate that could echo nationally in the push to slash greenhouse gas emissions.
Democratic state lawmakers have proposed two sweeping pieces of legislation — including what would be the first-ever statewide ban in the U.S. on all new oil and gas wells.
The bills are case studies of a rising intolerance to oil and gas production in blue states, even in a place like Colorado known for its large fossil fuel footprint.
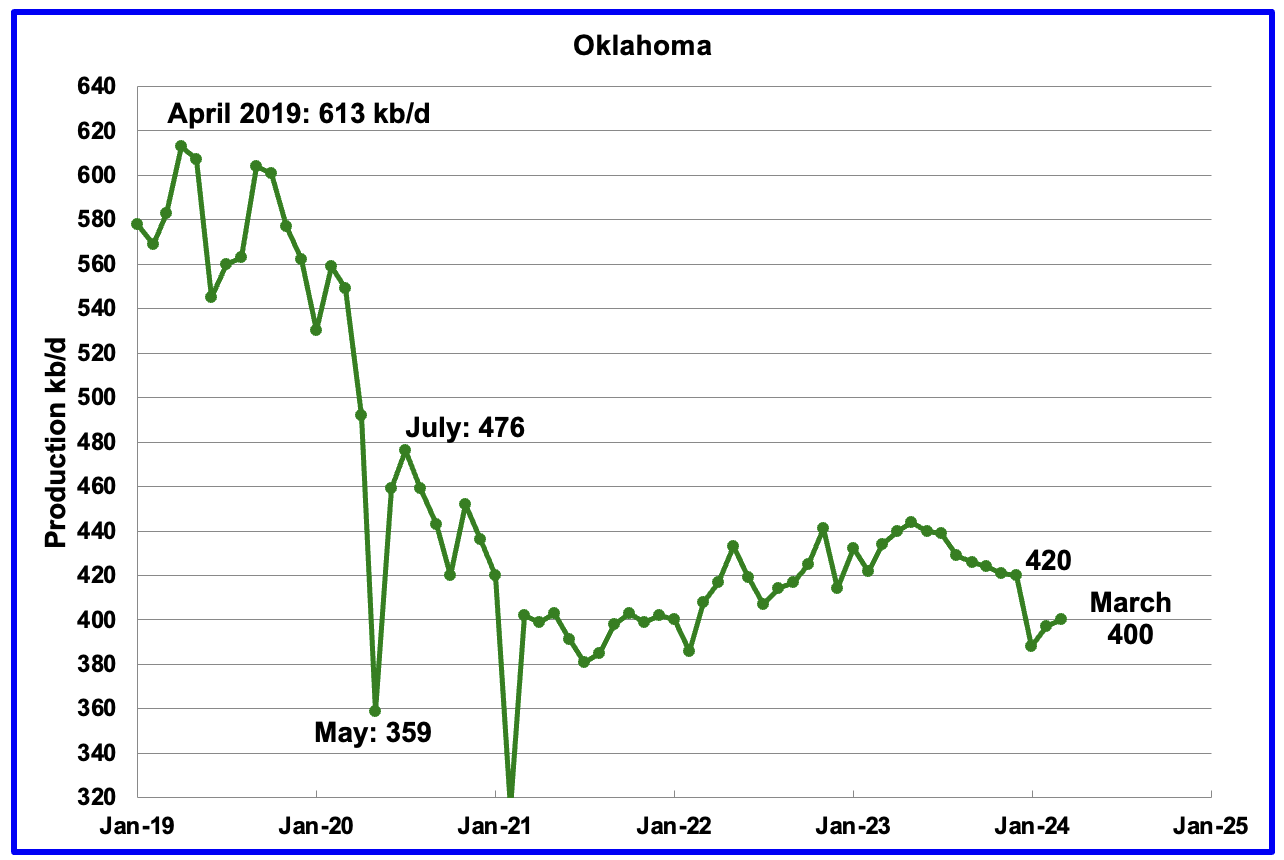
Oklahoma’s output in March rose by 3 kb/d to 400 kb/d. Production remains below the post pandemic July 2020 high of 476 kb/d. Output appears to have entered a slow declining/plateau phase. Note that January production dropped by 32 kb/d while February only rose 9 kb/d.
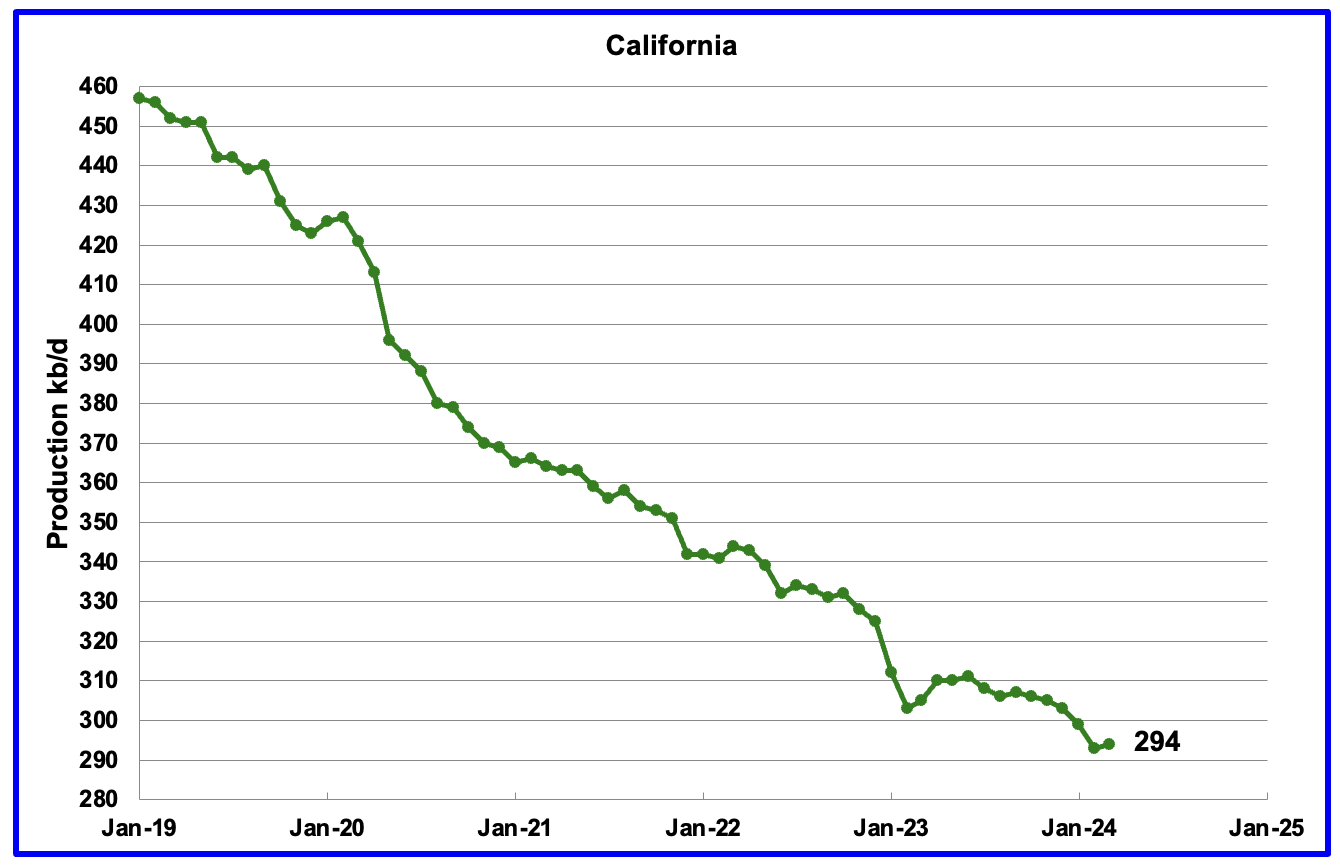
Californiaʼs March production had a slight reprieve to its slow decline by increasing by 1 kb/d to 294 kb/d. Production on average appears to be dropping at the rate of 2 kb/d/mth. From February 2021 to February 2024, production has dropped by 73 kb/d or close to 2 kb/d/mth.
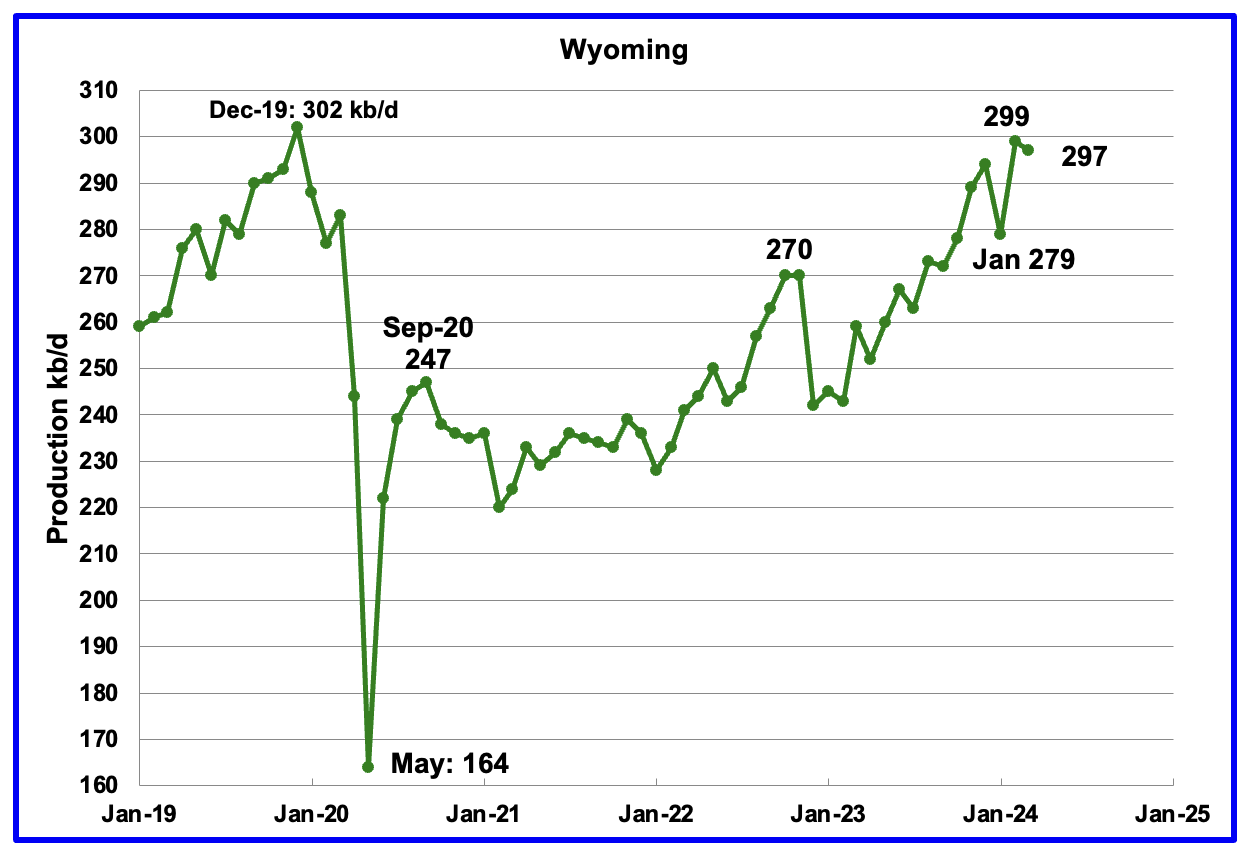
Wyoming’s oil production has been rebounding since March 2023. However the rebound was impacted by the January 2023 storm. While February’s oil production recovered from January’s drop by 20 kb/d to a new post pandemic high of 299 kb/d, March production dropped 2 kb/d to 297 kb/d.
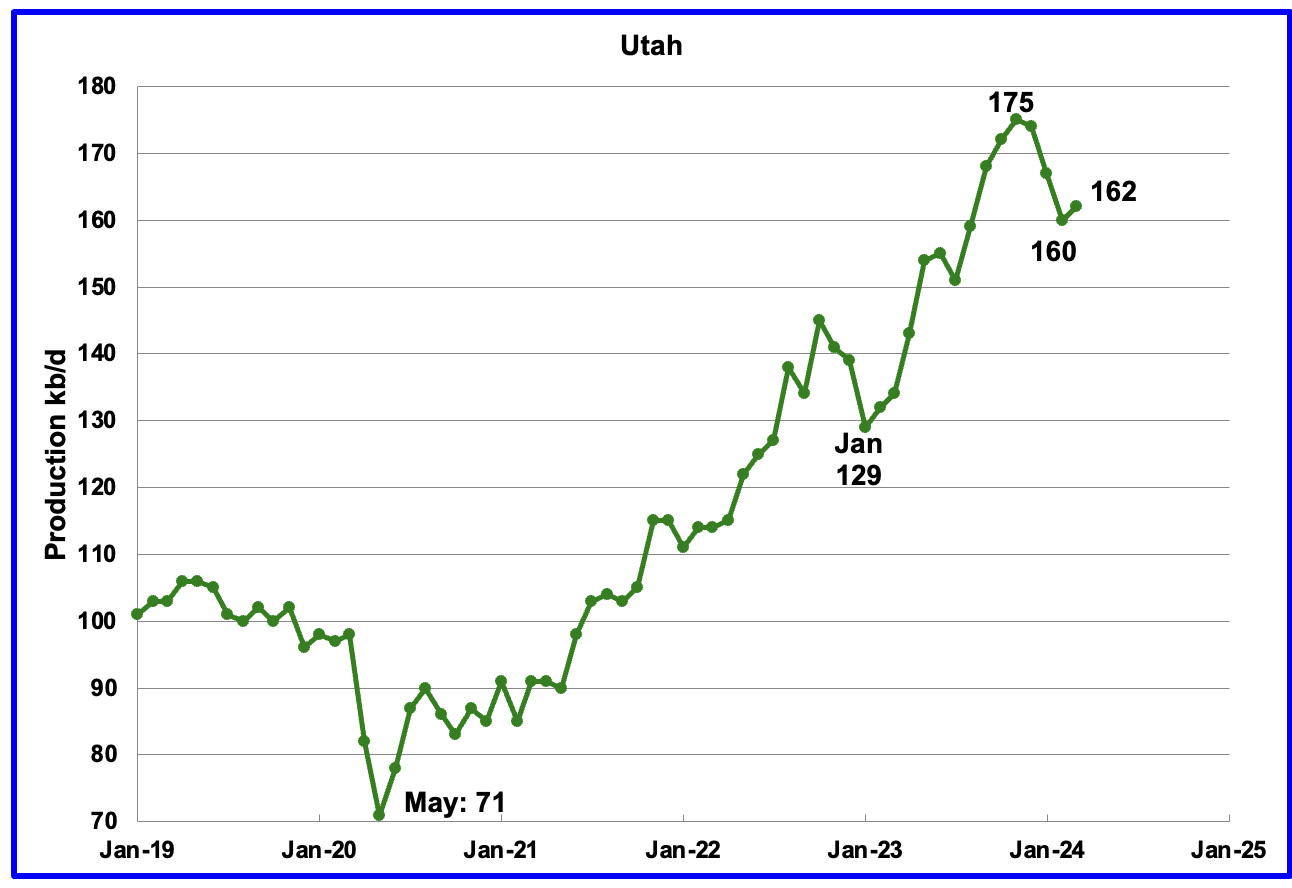
March’s production increased by 2 kb/d to 162 kb/d. For the first 5 months of 2024, Utah has had 9 oil rigs in operation. It is not clear why production dropped.
According to this article, one producer is using more proppant to increase production.
The mastermind behind Utah’s production increase is outlined in this article.
“Finley and other producers’ long-term vision for the Uinta could lead to as much as 350,000 barrels of crude oil being railed from Utah to Gulf Coast refineries every day, roughly tripling current basin production and increasing U.S. annual carbon emissions by 1%.”
The increased production since February 2023 has come from the Uinta basin.
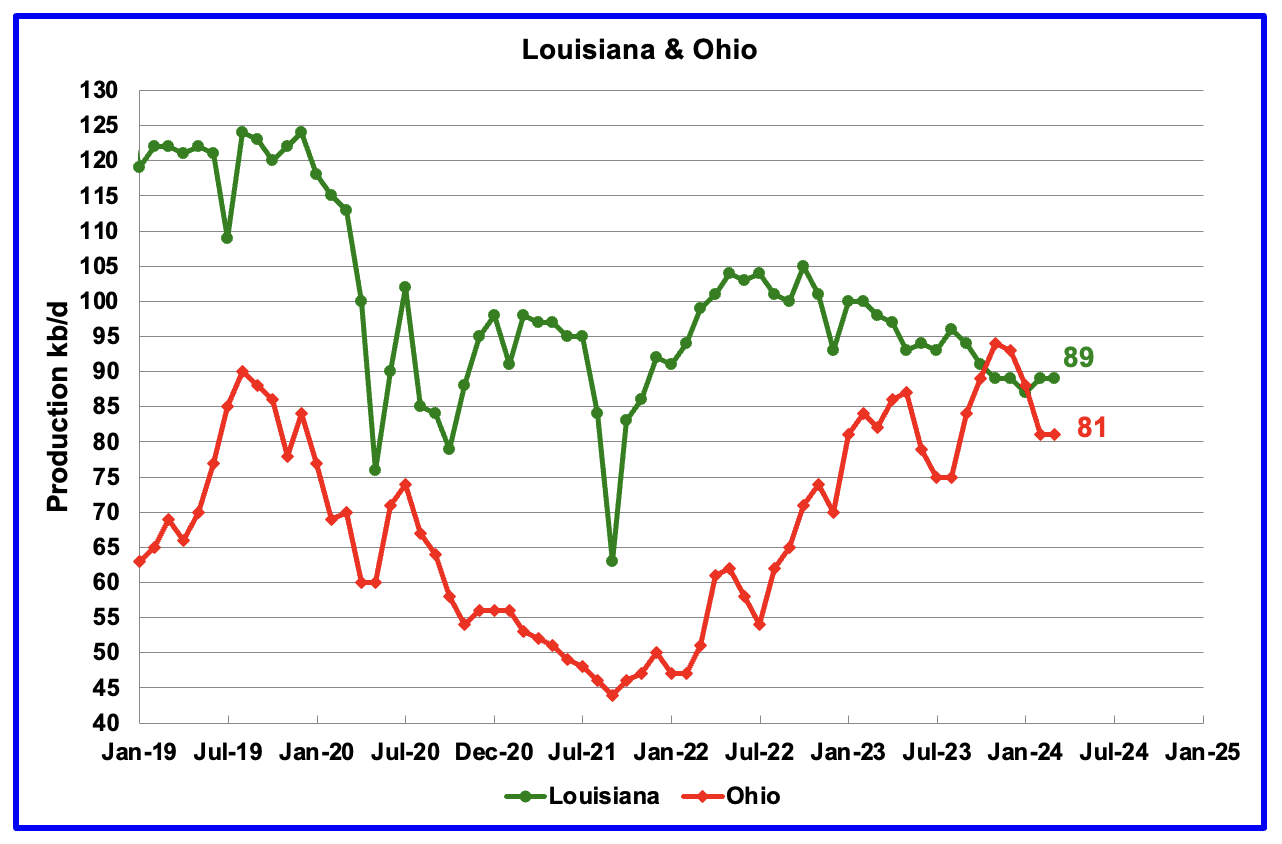
Ohio has been added to the Louisiana chart because Ohio’s production has been slowly increasing since October 2021 and passed Louisiana in November 2023.
Louisiana’s output entered a slow decline phase in October 2022. March’s production was unchanged at 89 kb/d. Ohio’s oil production was also unchanged at 81 kb/d after reaching a post pandemic high of 94 kb/d in November. The most recent Baker Hughes rig report now shows two horizontal oil rigs operating in Ohio in May.
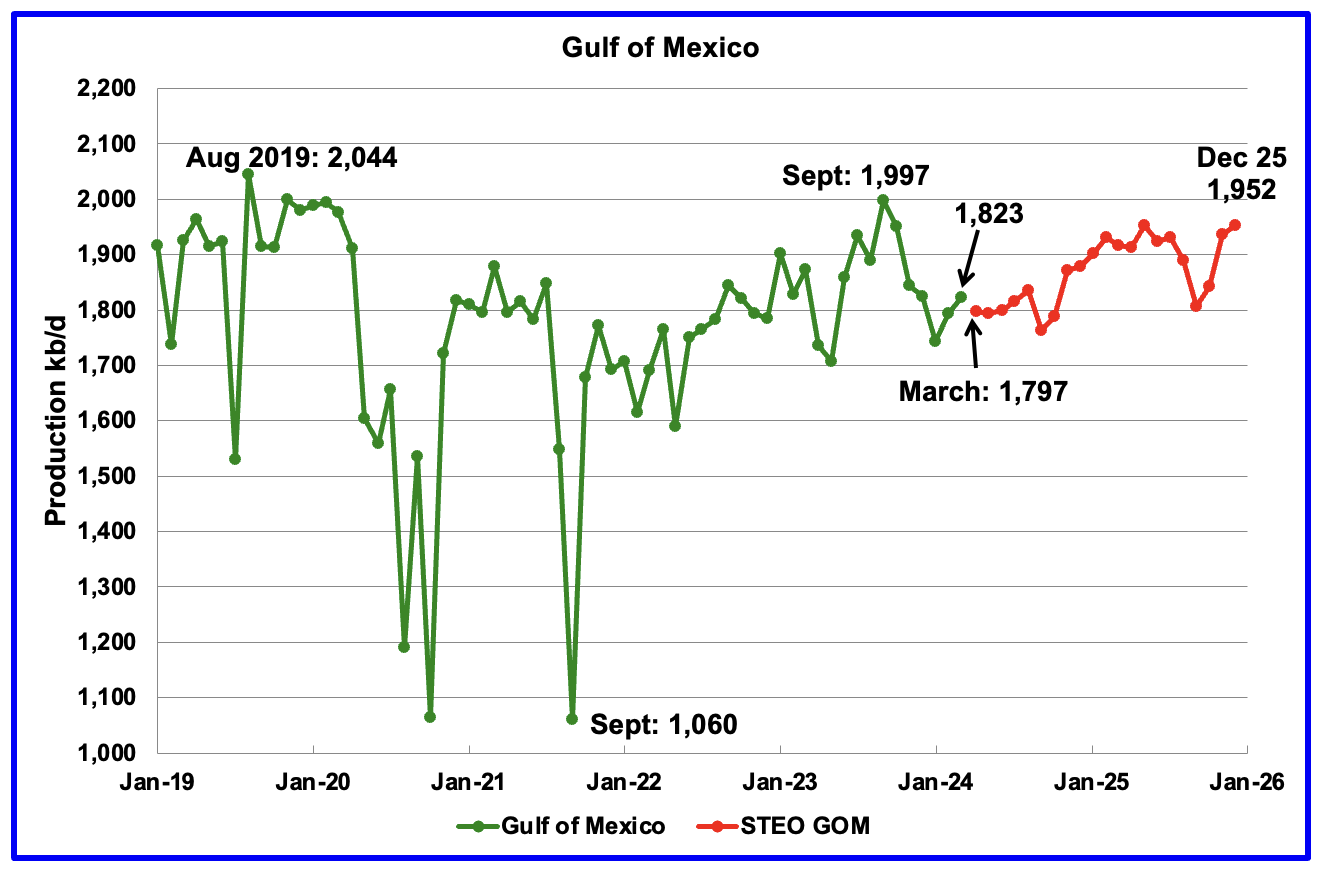
GOM production rose by 30 kb/d in March to 1,823 kb/d but is expected to drop in April by 26 kb/d to 1,797 kb/d.
The May 2024 STEO projection for the GOM output has been added to this chart. It projects production from April 2024 to December 2025 will increase by 155 kb/d to 1,952 kb/d, 60 kb/d lower than reported in the previous STEO.
A Different Perspective on US Oil Production
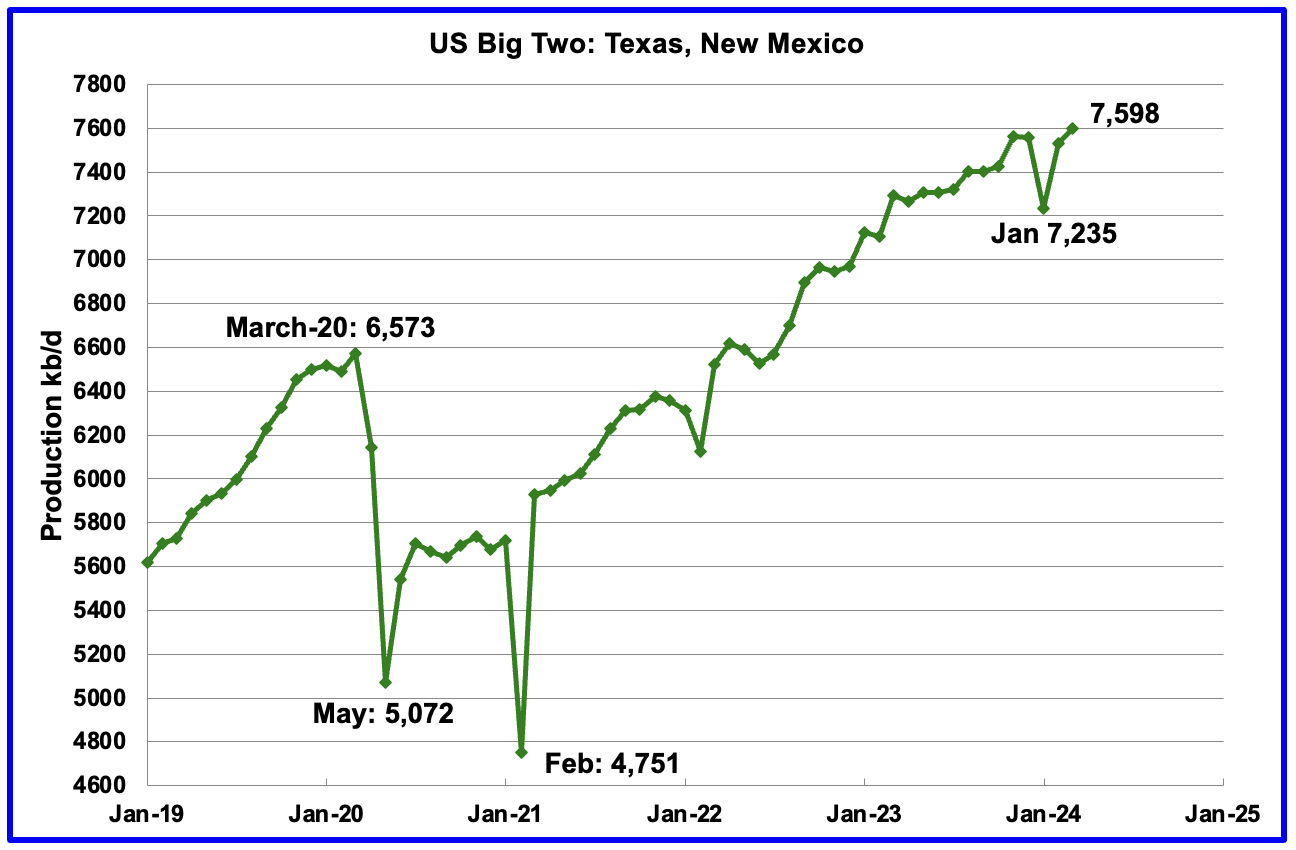
The Big Two states’ combined oil output for Texas and New Mexico.
March’s production in the Big Two states increased by a combined 68 kb/d to 7,598 kb/d with Texas adding 36 kb/d while New Mexico added 32 kb/d.
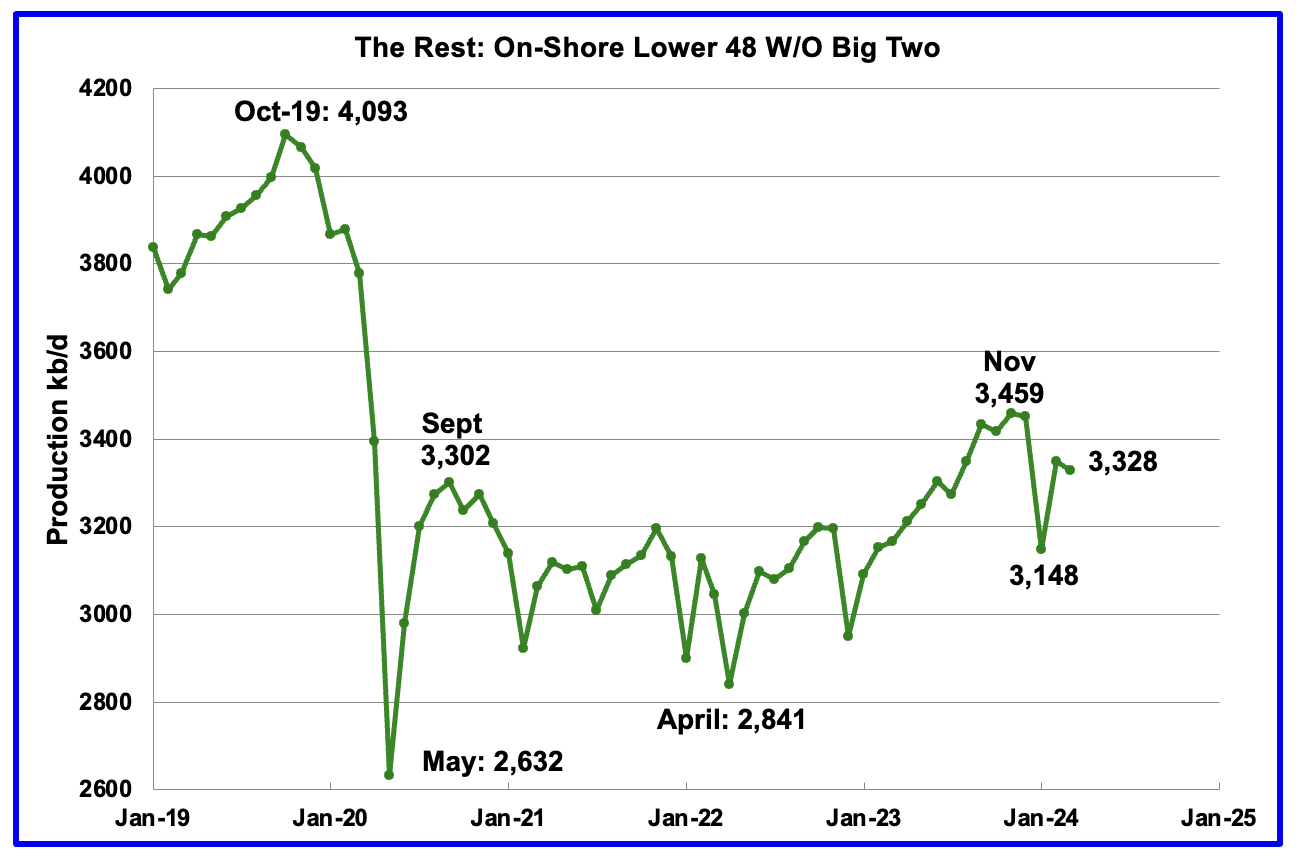
Oil production by The Rest
March’s oil production in The Rest decreased by 22 kb/d to 3,328 kb/d.
The main takeaway from The Rest chart is that current production is below the high of October 2019 and is a significant loss that occurred during the Covid shut down and will not be readily recovered.
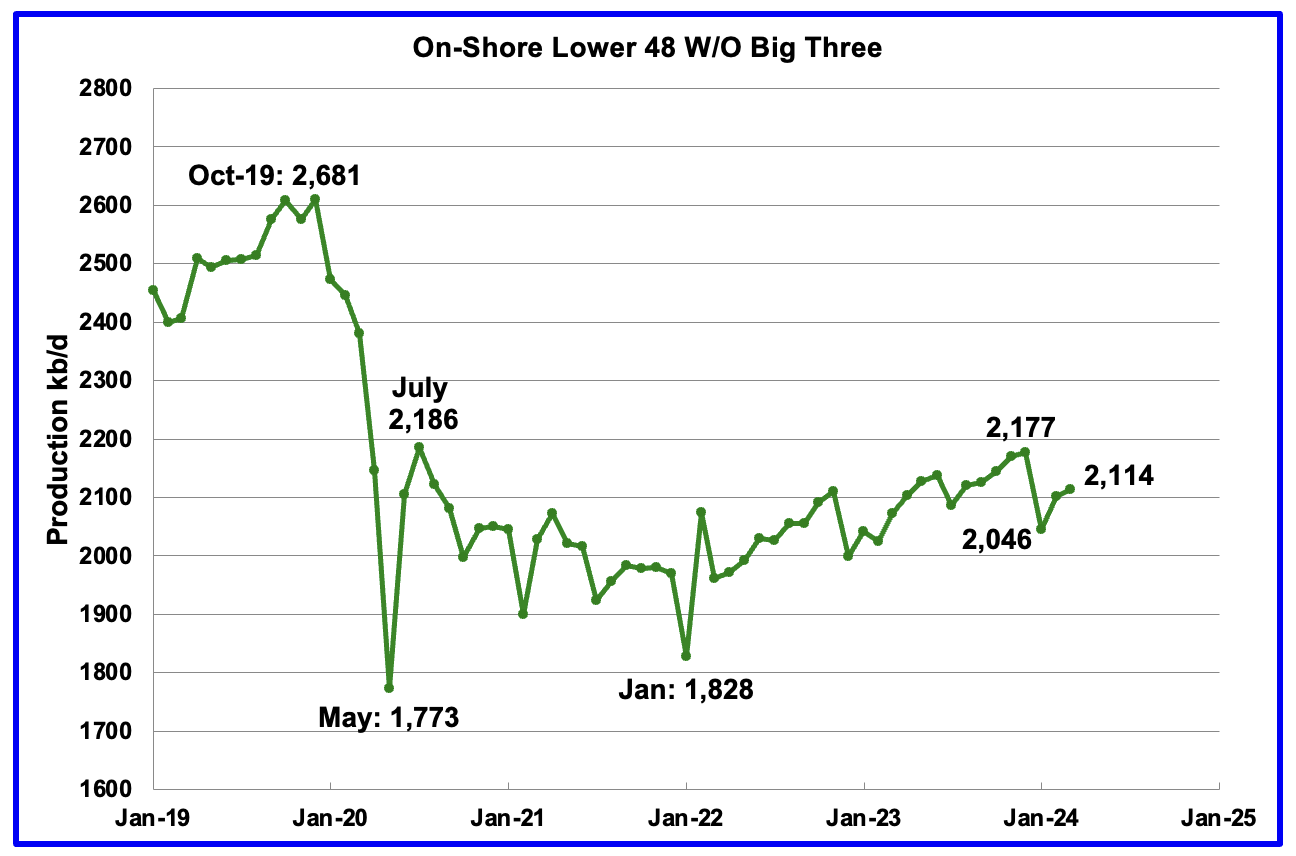
The On-Shore lower 48 W/O the big three, Texas, New Mexico and North Dakota, shows a slow rising production trend from the low of January 2022 to December 2023. March’s production increased by 12 kb/d to 2,114 kb/d.
Permian Basin Report by Main Counties and Districts
This special monthly Permian section was recently added to the US report because of a range of views on whether Permian production will continue to grow or will peak over the next year or two. The issue was brought into focus recently by the Goehring and Rozencwajg Report which indicated that a few of the biggest Permian oil producing counties were close to peaking or past peak. Also comments by posters on this site have similar beliefs from hands on experience.
This section will focus on the four largest oil producing counties in the Permian, Lea, Eddy, Midland and Martin. It will track the oil and natural gas production and the associated Gas Oil Ratio (GOR) on a monthly basis. The data is taken from the state’s government agencies for Texas and New Mexico. Typically the data for the latest two or three months is not complete and is revised upward as companies submit their updated information. Note the natural gas production shown in the charts that is used to calculate the GOR is the gas coming from both the gas and oil wells.
Of particular interest will be the charts which plot oil production vs GOR for a county to see if a particular characteristic develops that indicates the field is close to entering the bubble point phase. While the GOR metric is best suited for characterizing individual wells, counties with closely spaced horizontal wells may display a behaviour similar to individual wells due to pressure cross talking . For further information on the bubble point and GOR, there are a few good thoughts on the intricacies of the GOR in an earlier POB comment. Also check this EIA topic on GOR.
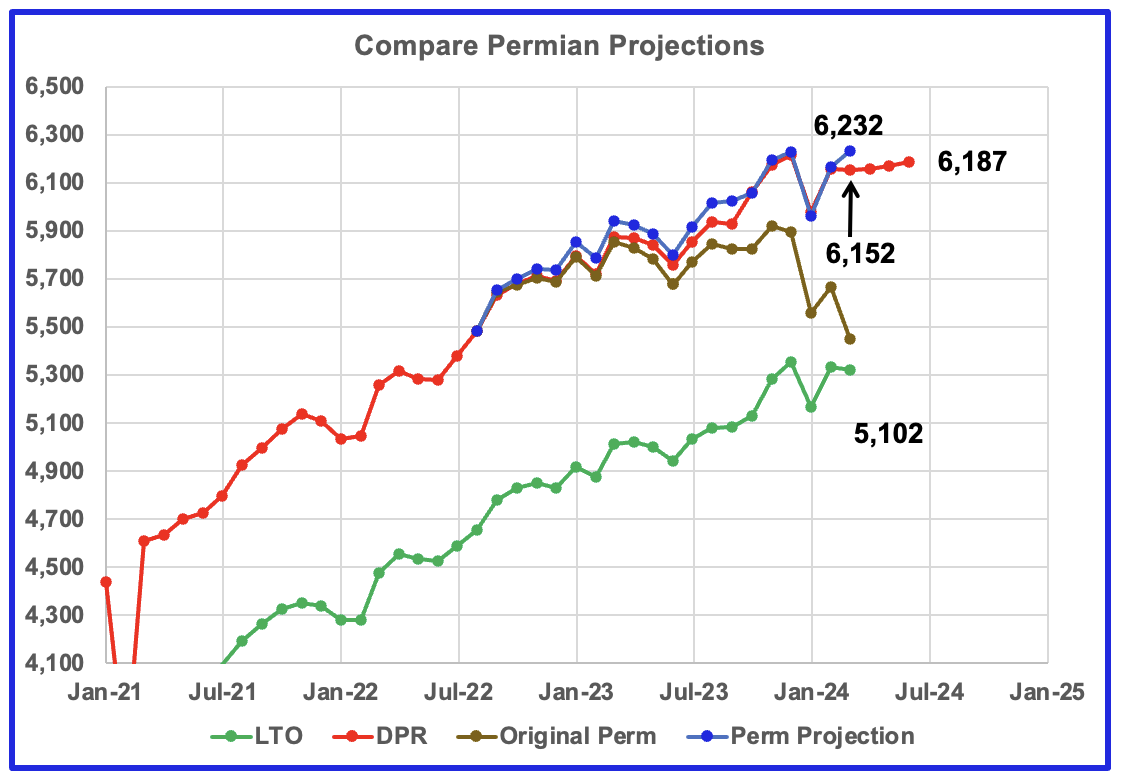
This chart shows four oil production graphs for the Permian basin updated to March and to June for the DPR. The gap between the DPR and LTO projections is there because the DPR projection includes both LTO oil along with oil from conventional wells in the basins that it covers.
The red and green graphs show oil production as published by the EIA’s DPR and the LTO offices. Comparing the two, it appears that both the LTO and DPR offices believe Permian LTO production is currently in a plateauing phase. The blue graph is a projection for Permian oil production. The brown chart is the sum of preliminary Permian production data as taken from the Texas RRC and the New Mexico Oil Conservation Division. The big January drop is due to severe weather in the central US.
The blue Permian projection graph only uses two months of preliminary production data, February and March, from the New Mexico OCD and the Texas RRC to make its March projection. The Permian projection is showing an extra 80 kb/d over the DPR production estimate for March.
The initial attempt to project the combined Texas and Permian results using the same methodology as used to project New Mexico production has not been successful. A modification has been introduced for projecting Texas results and limited back testing was undertaken. It will take a few more months of Texas data to see if the modification gives reasonable results.
New Mexico Permian
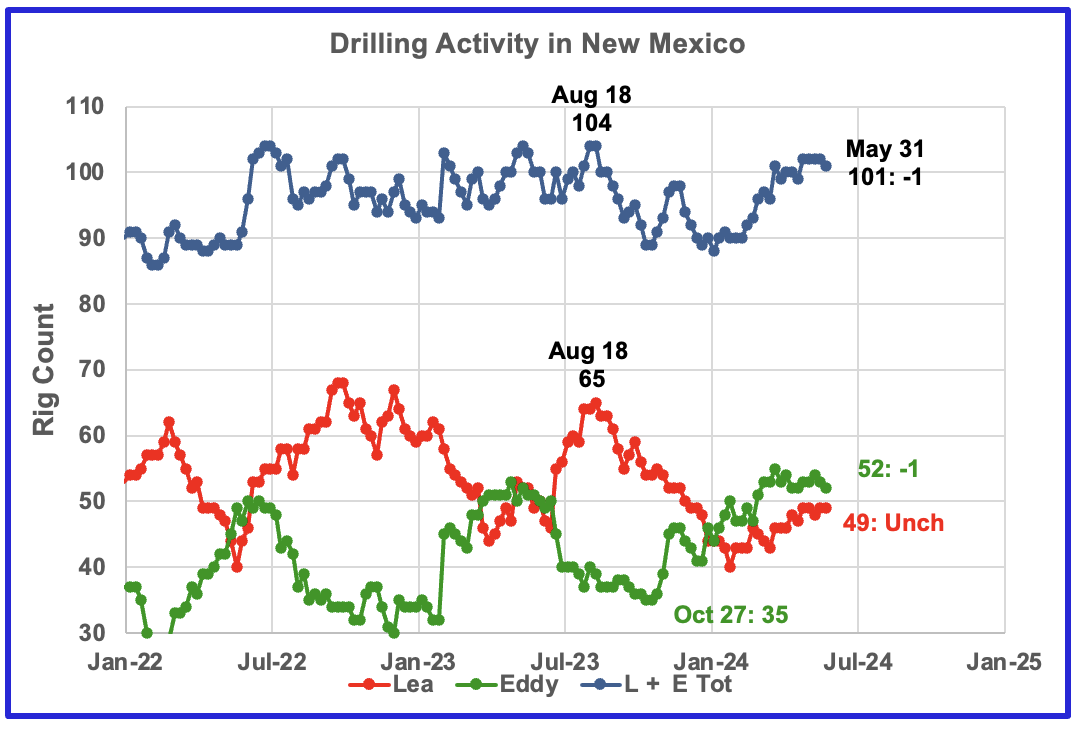
Since the middle of August 2023, the Lea county rig count has dropped from 65 rigs to 40 rigs in late January. For all of May 2024 the rig count has held steady at 49 rigs. At the same time production has increased slightly to 1,156 kb/d over the period January 2023 to February 2024. See next chart.
From a low of 35 rigs in late October 2023, 20 rigs moved into Eddy county at its peak in late March, 55. Currently 52 rigs are operating. Something is happening in Eddy county which will take at least six months to show up.
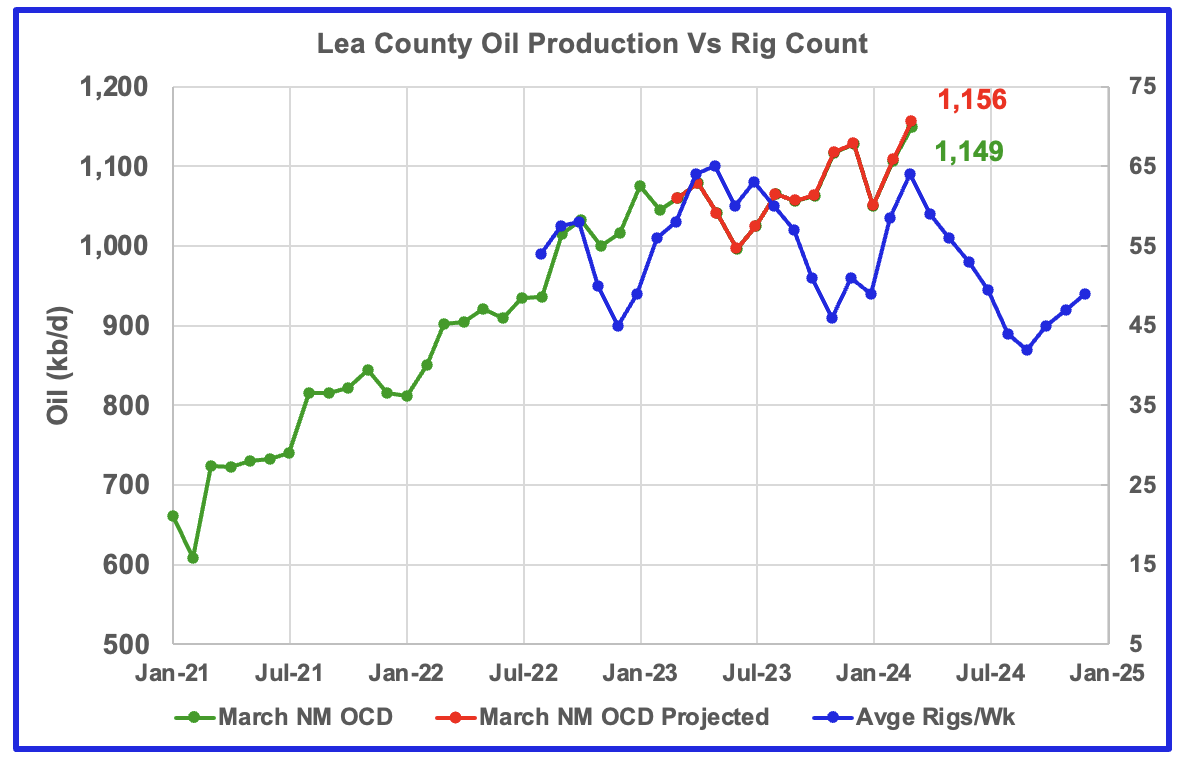
Preliminary March data indicates Lea County oil production increased by 47 kb/d to a new record high of 1,149 kb/d. A projection for March’s final production estimates it will be closer to 1,156 kb/d.
The blue graph shows the average number of weekly rigs operating during a given month as taken from the above weekly rig chart. The rig graph has been shifted forward by 7 months. So the 64 Rigs/wk operating in August 2023 have been time shifted forward to February 2024 to show the possible correlation and time delay between rig count and oil production. If the oil production were to follow the rig count going forward, oil production in Lea County should begin to drop in April or May.
Note that rig counts are being used to project production as opposed to completions because very few extra DUCs are being completed at this time.
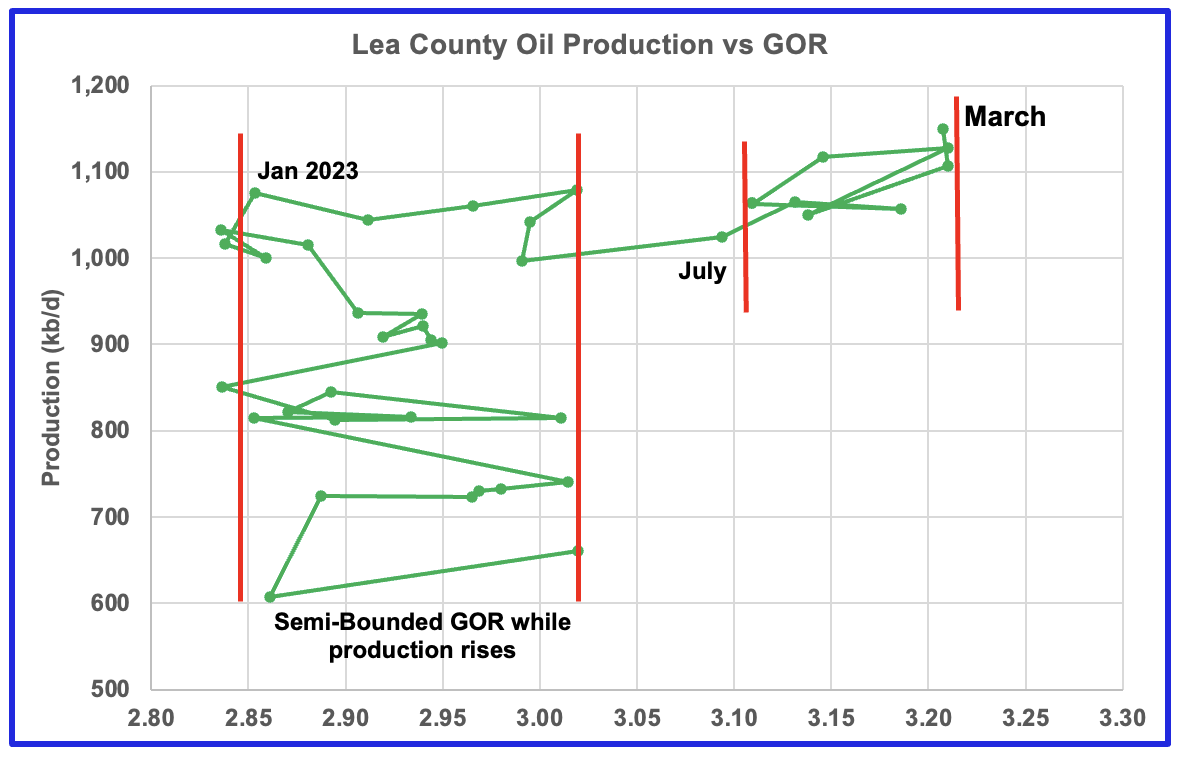
After much zigging and zagging, oil production in Lea county stabilized just above 1,000 kb/d. Once production reached a new high in January 2023, production essentially plateaued but the GOR started to increase rapidly to the right and entered the bubble point phase in July 2023.
However Lea county GOR has continued to increase as production reached a new high in March. This may indicate that the current production increase is coming from a new bench since the GOR’s behaviour since August 2023 to March 2024 time frame appears once again to be in a semi bounded GOR phase and rising production.
This zigging and zagging GOR pattern within a semi-bounded GOR while oil production increases to some stable level and then moves out to a higher GOR to the right has shown up in a number of counties. See an additional two cases below. This is the ninth month in which Lea county has registered a GOR outside the first semi-bounded GOR range.
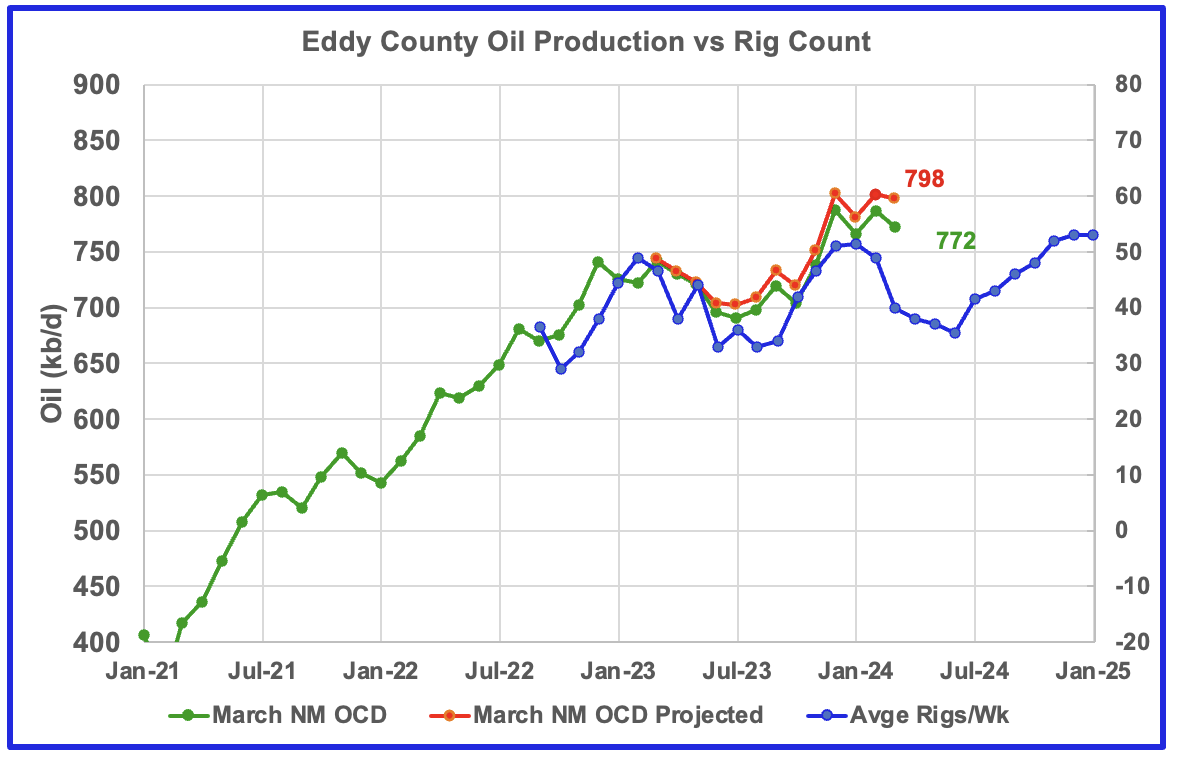
Eddy county oil production was showing signs it was in a plateau phase up to October 2023. However, production began to rise in November and hit a new projected high of 802 kb/d in February 2024. The rising production must be associated with the large increase in the rig count starting in February 2023. March production dropped by 4 kb/d to 798 kb/d.
The blue graph shows the average number of weekly rigs operating during a given month as taken from the above weekly drilling chart. The rig graph has been shifted forward by 7 1/2 months to roughly coincide with the peak in the production graph.
If production were to follow the rig count trend going forward, Eddy production should begin to drop in March/April before rising again starting in June/July.
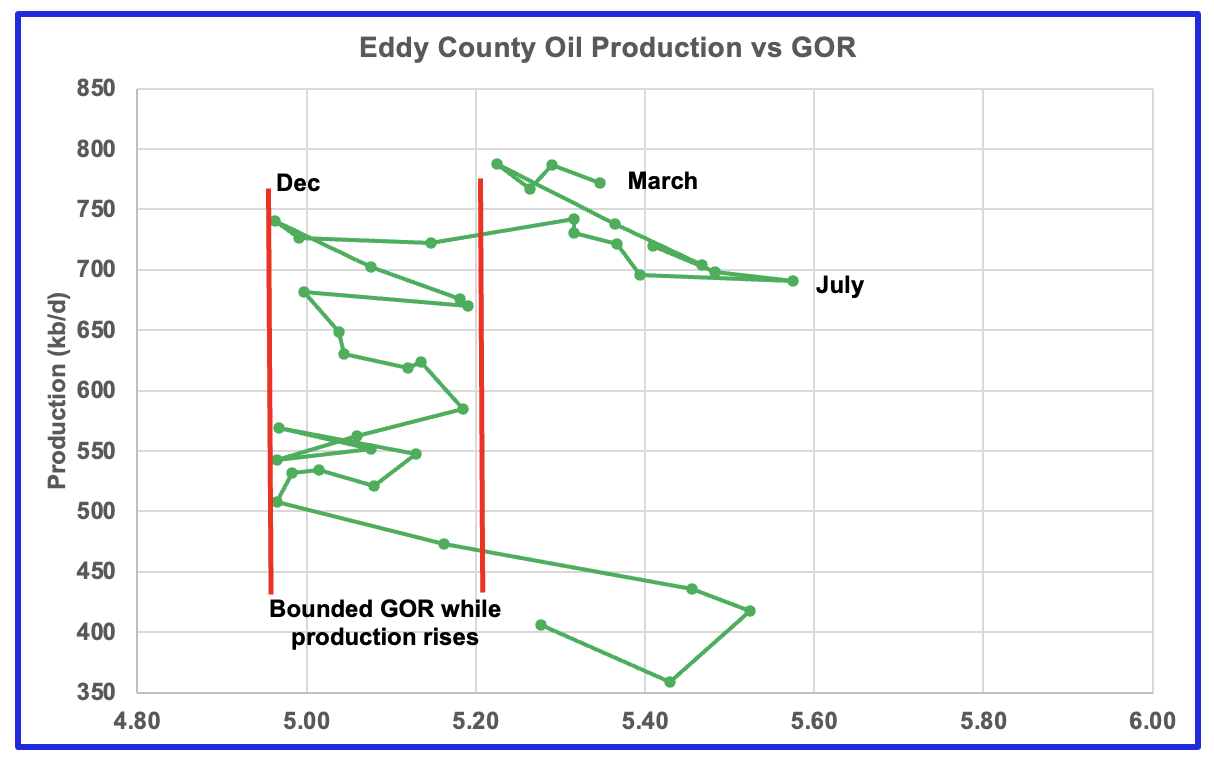
The Eddy county GOR pattern is similar to Lea county except that Eddy broke out from the semi bounded range earlier and for a longer time. For the last four months preliminary oil production has been bouncing between 750 kb/d and 800 kb/d.
August 2023 saw a reversal in the increasing GOR trend by decreasing which then was followed by the current oil production increase which reached a new high in December 2023, an atypical pattern. Since January the GOR has begun to increase again and production has been essentially flat.
The new November to March production highs along with a slowly changing GOR might indicate that drilling in Eddy county has punched into a new bench or some older wells are being refracted? Regardless Eddy might be on a plateau for the next few months and then begin to decline.
Texas Permian
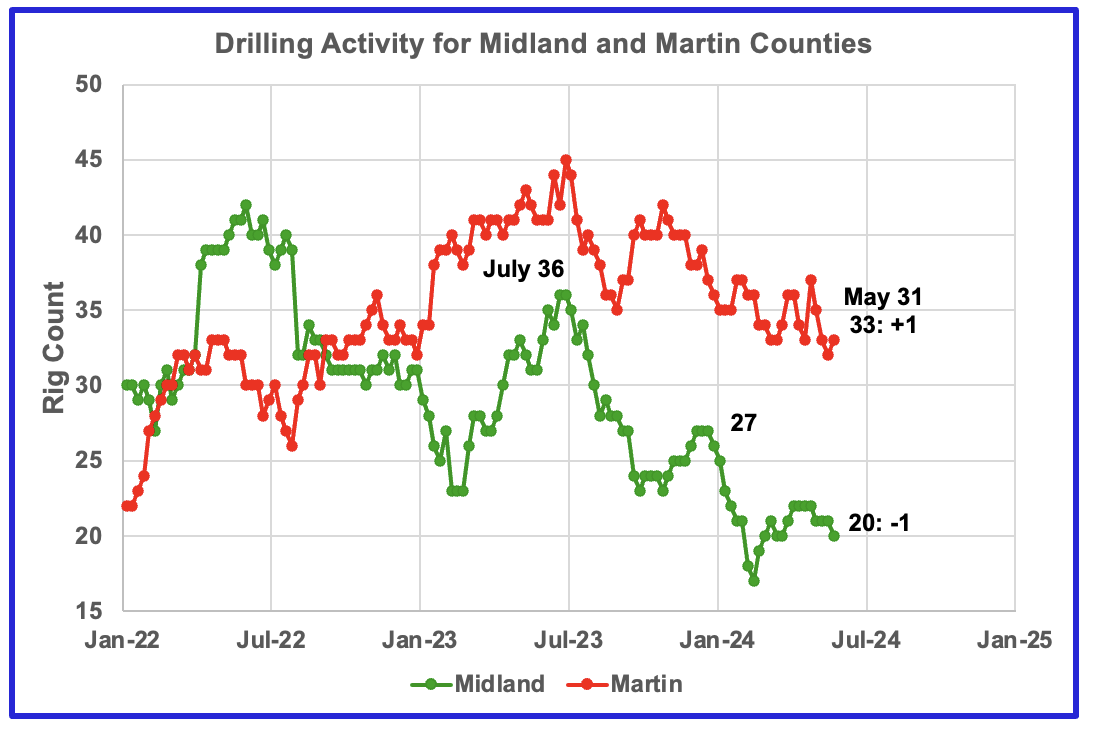
The rig count in Midland county started to drop again in May. Martin county rigs remain close to the lows of 2024. At the end of May the rig count was 20, down 7 from December.
Martin county rigs are in a slow decline and at the end of May the rig count totalled 33 down 4 from the beginning of May.
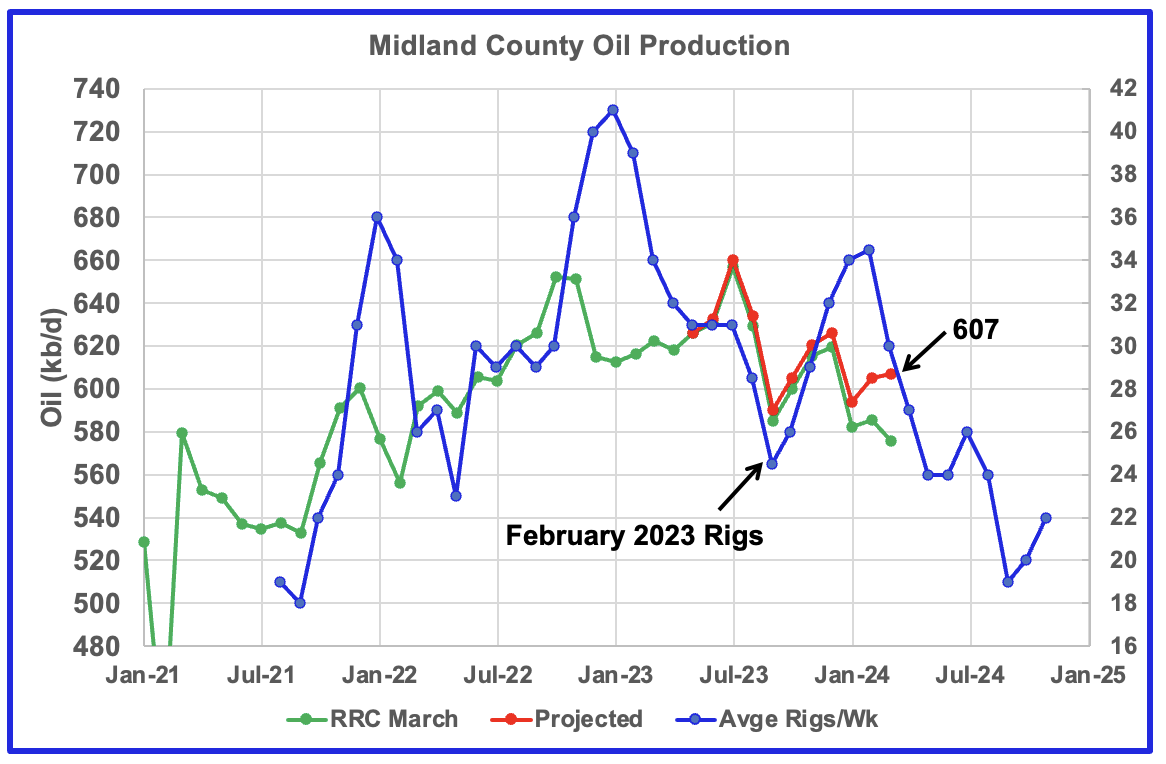
Midland County oil production appears to be in a slow and steady declining phase that started in August 2023. The green graph shows March’s preliminary production as reported by the Texas RRC. Note the small March drop. The rising production starting in October 2023 may be related to the rising drilling activity which started in March 2023. If correct, this implies Midland production peaked in July 2023.
The blue graph shows the average number of weekly rigs operating during a given month as taken from the previous weekly drilling chart. The rig graph has been shifted forward by seven months. So the 34.5 Rigs/wk operating in August 2023 have been moved forward to January 2024 to show the possible correlation and time delay between rig count and oil production. If the seven month shift in the rig count is approximately correct in that oil production can be tied to the rig count, oil production in Midland county should resume its decline after April/May 2024.
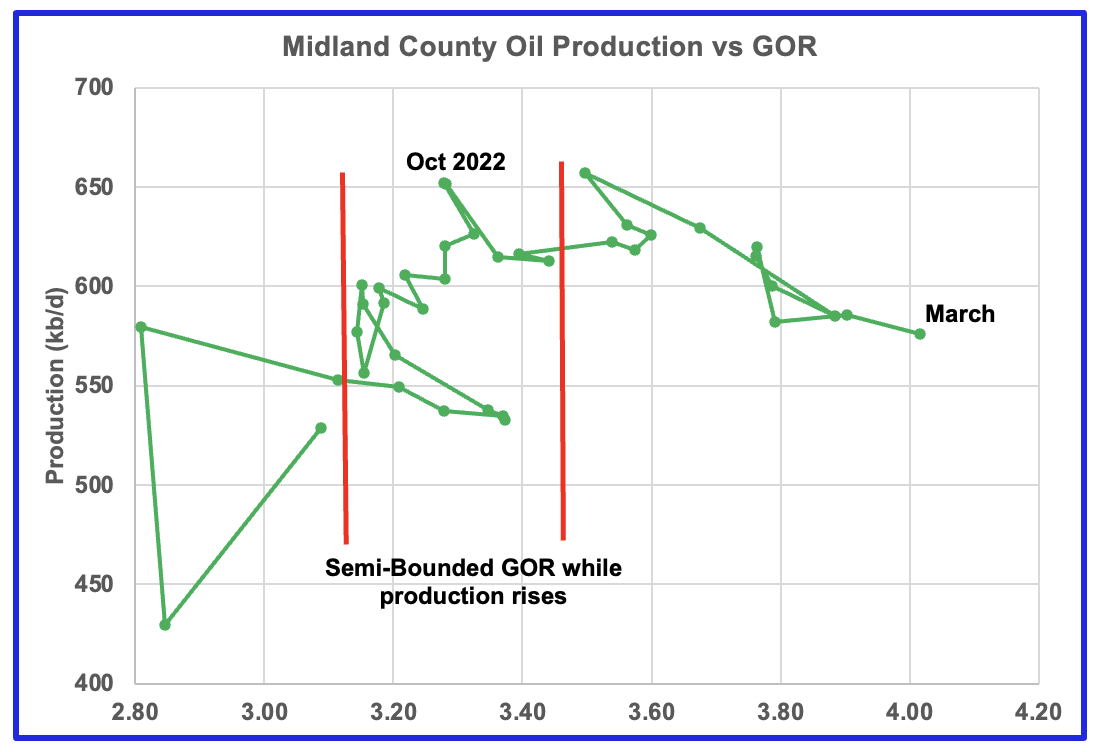
With Midland county deep into the bubble point phase, oil production continues to drop from previous highs, based on the previous graph, and should resume dropping in April/May. Note that oil production and GOR in this chart is based on the RRC March production data.
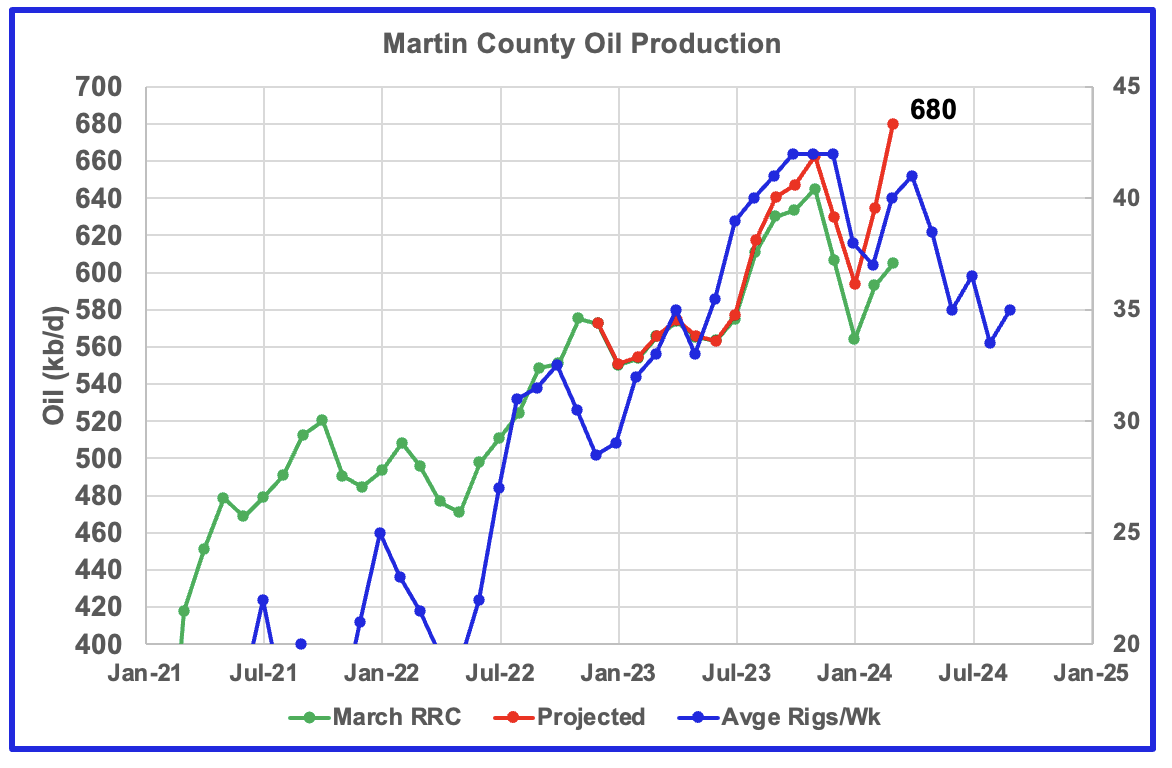
This chart shows Texas RRC oil production for Martin County. It was showing initial signs of peaking in November 2023. However projected March production exceeded November by rising to 680 kb/d. The rise followed the increase in rig count according to the time shifted rig count.
The red graph is a production forecast which the Texas RRC could be reporting for Martin county about one year from now as drillers report additional updated production information. This projection is based on a modified methodology that used February and March production data and will be re-estimated each month going forward. Production should begin to fall in April or May if production follows the rig count.
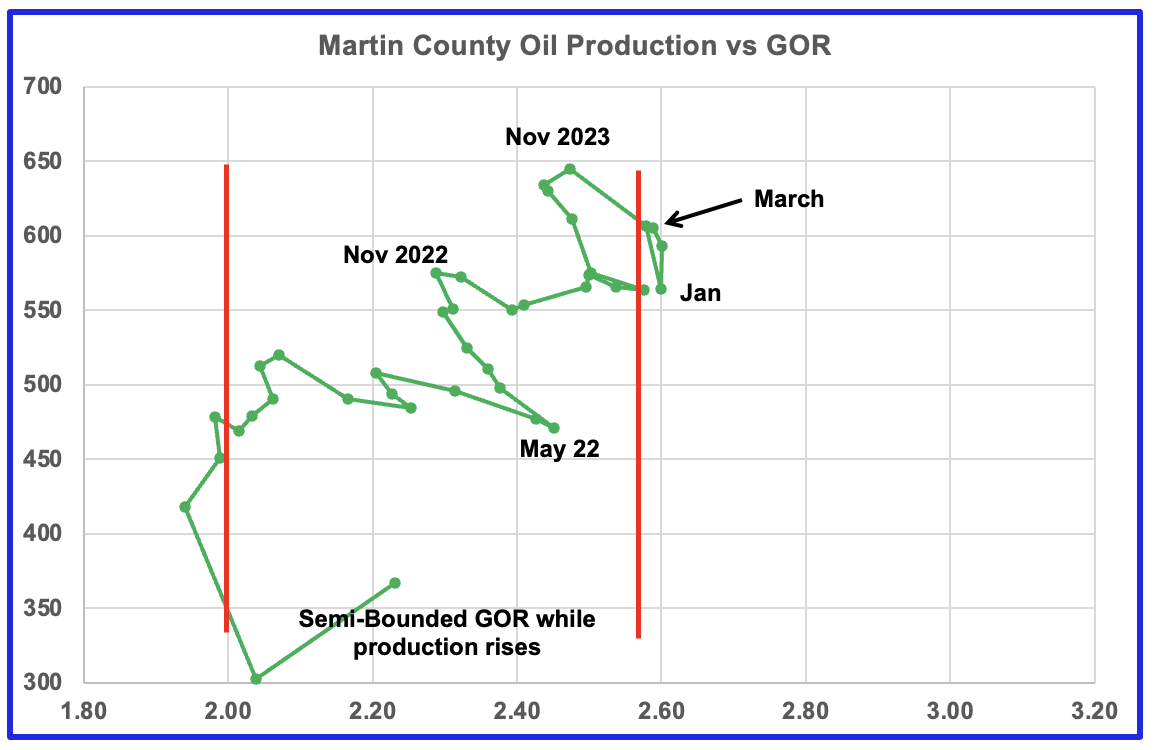
Martin county’s oil production and GOR up to December 2023 stayed within the semi bounded range and near peak oil production. However January, February and March saw production move higher while the GOR remained essentially unchanged at 2.6. Martin county has the lowest GOR of the four counties at a GOR of 2.60. Martin may be on the verge of entering the bubble point phase that results in a dropping oil production trend.
Exactly where to put the right hand red GOR boundary for Martin county is not exactly obvious. It is possible that the right boundary should be closer to a GOR of 2.5. Note the red line has been moved from 2.6 so that the production can be seen.
Findings
Forecast oil production continues to rise for Lea county while Eddy county is indicating signs of plateauing. However the rise and plateauing are due to increased drilling activities from months back and New Mexico production may be near a peak as drilling activity starts to decline.
Martin county production continues to make new highs but could be approaching a peak in a month or two if production follows the time delayed drilling trend in Martin County.
Midland county has peaked and has entered a declining phase.
Texas District 8
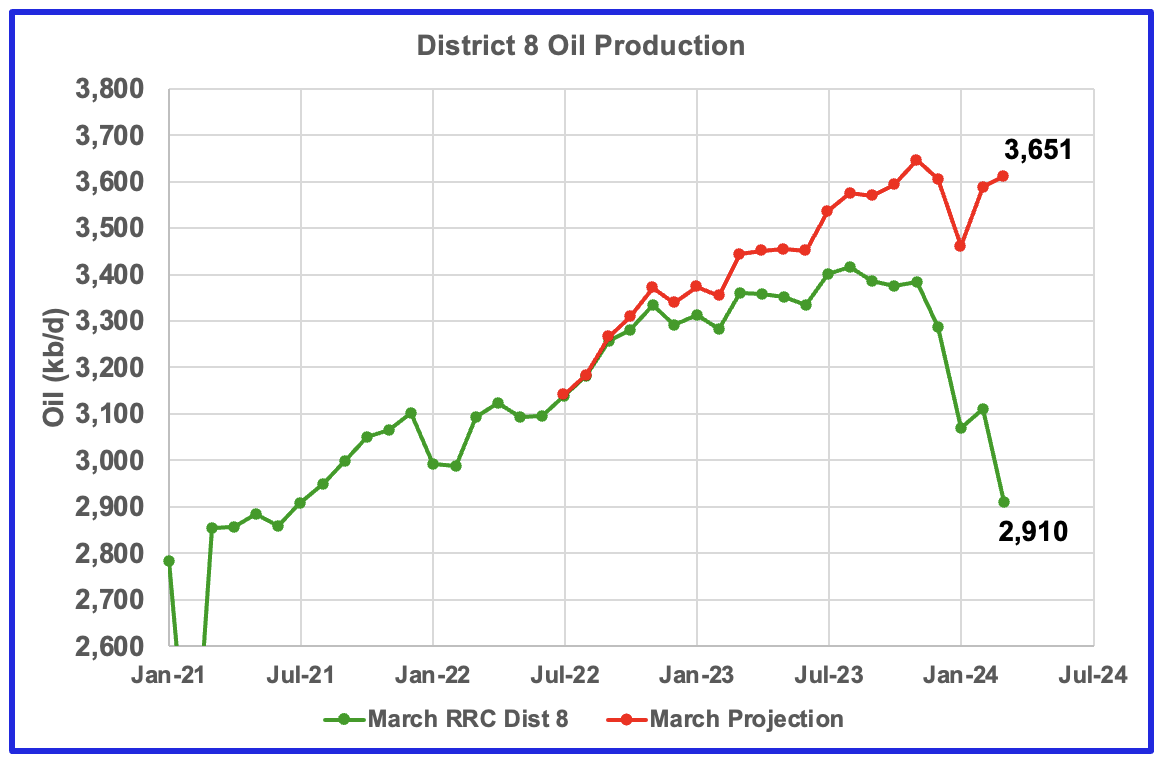
Texas District 8 contains both the Midland and Martin counties. Combined these two counties produce close to 1,200 kb/d of oil. While these two counties are the two largest oil producers, there are many other counties with smaller production, Reeves #3 and Loving #4, that results in total production of close to 3,650 kb/d. Essentially the Midland and Martin counties produce 1/3 of the District 8 oil.
This chart shows a projection for District 8 oil production. The red graph, derived from February and March production data indicates that oil production in District 8 may be entering a plateau phase.
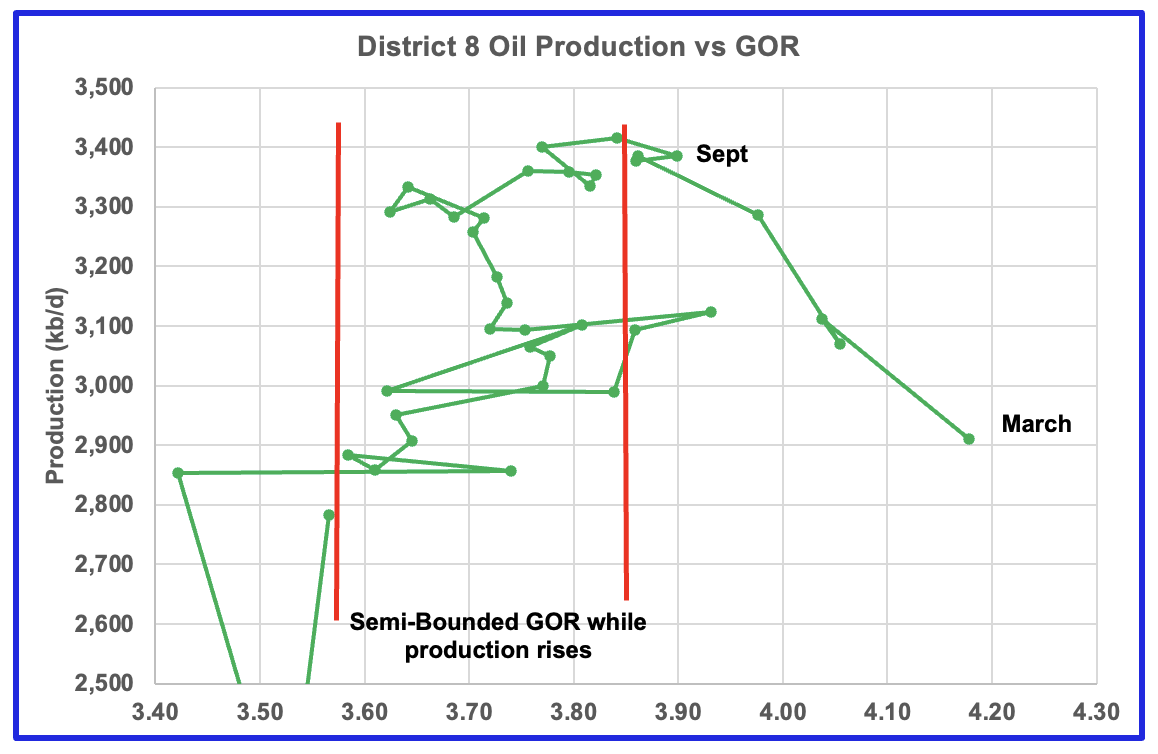
Plotting an oil production vs GOR graph for a district may be a bit of a stretch. Regardless here it is and it seems to indicate many counties may well be into the bubble point phase.
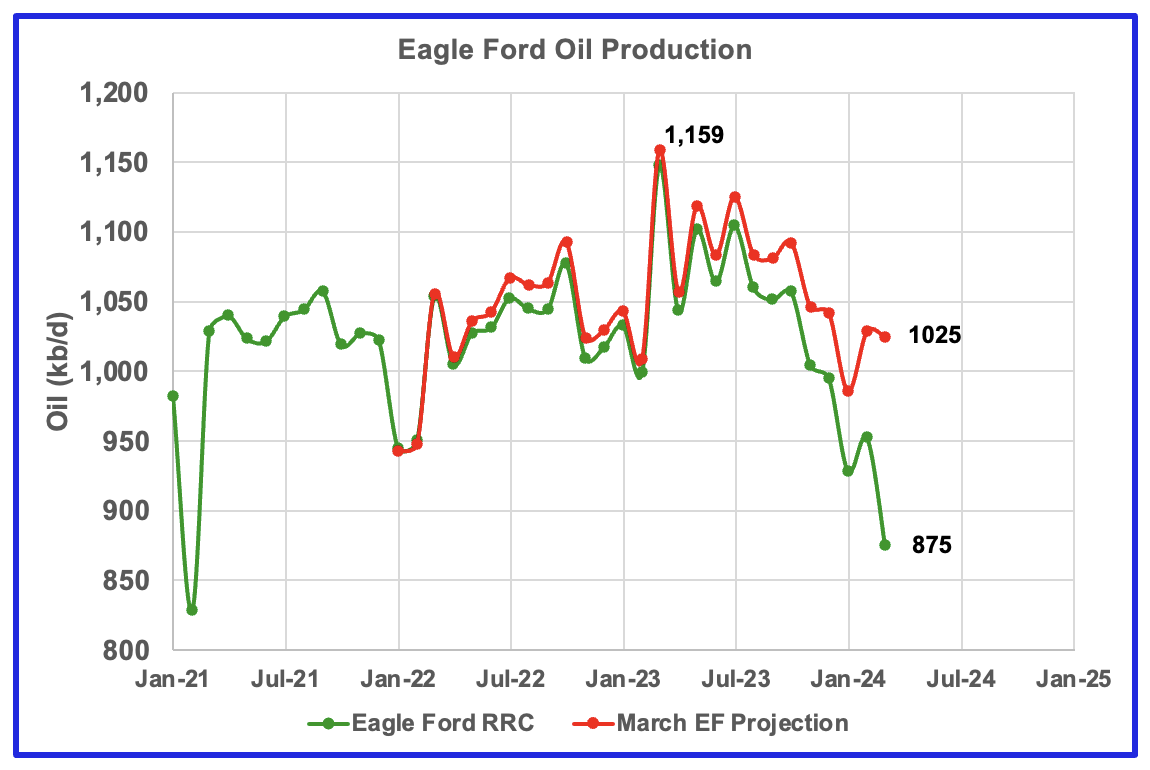
Production in the Eagle Ford is dropping and may have peaked in March 2023.
Drilling Productivity Report
The Drilling Productivity Report (DPR) uses recent data on the total number of drilling rigs in operation along with estimates of drilling productivity and estimated changes in production from existing oil wells to provide estimated changes in oil production for the principal tight oil regions. The May DPR report forecasts production to June 2024 and the following charts are updated to June 2024. The DUC charts and Drilled Wells charts are updated to April 2024.
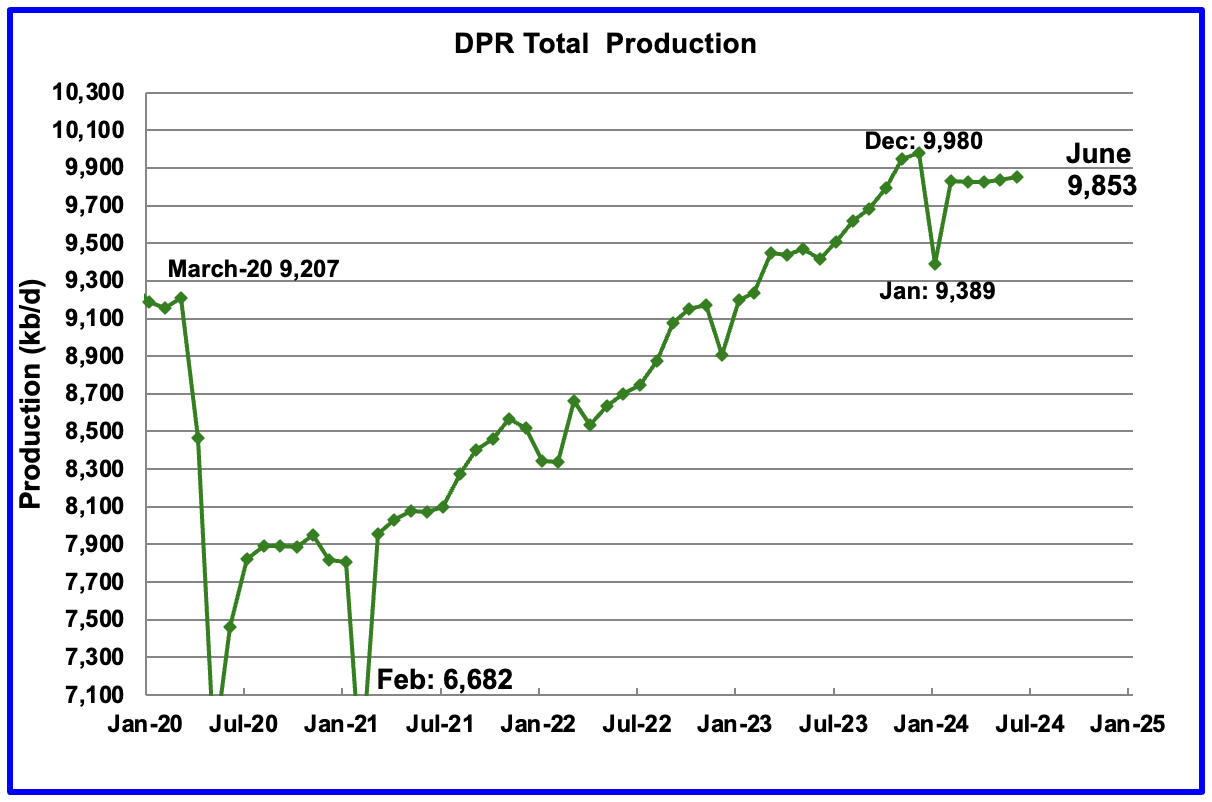
Above is the total oil production projected to June 2024 for the 7 DPR basins that the EIA tracks. Note DPR production includes both LTO oil and oil from conventional wells.
The DPR is projecting oil output for June 2024 will increase by 17 kb/d to 9,853 kb/d.
For the first time in many months, the May DPR report has also made a downward revision to its previous production forecast. For May, production was revised down by 27 kb/d to 9,836 kb/d.
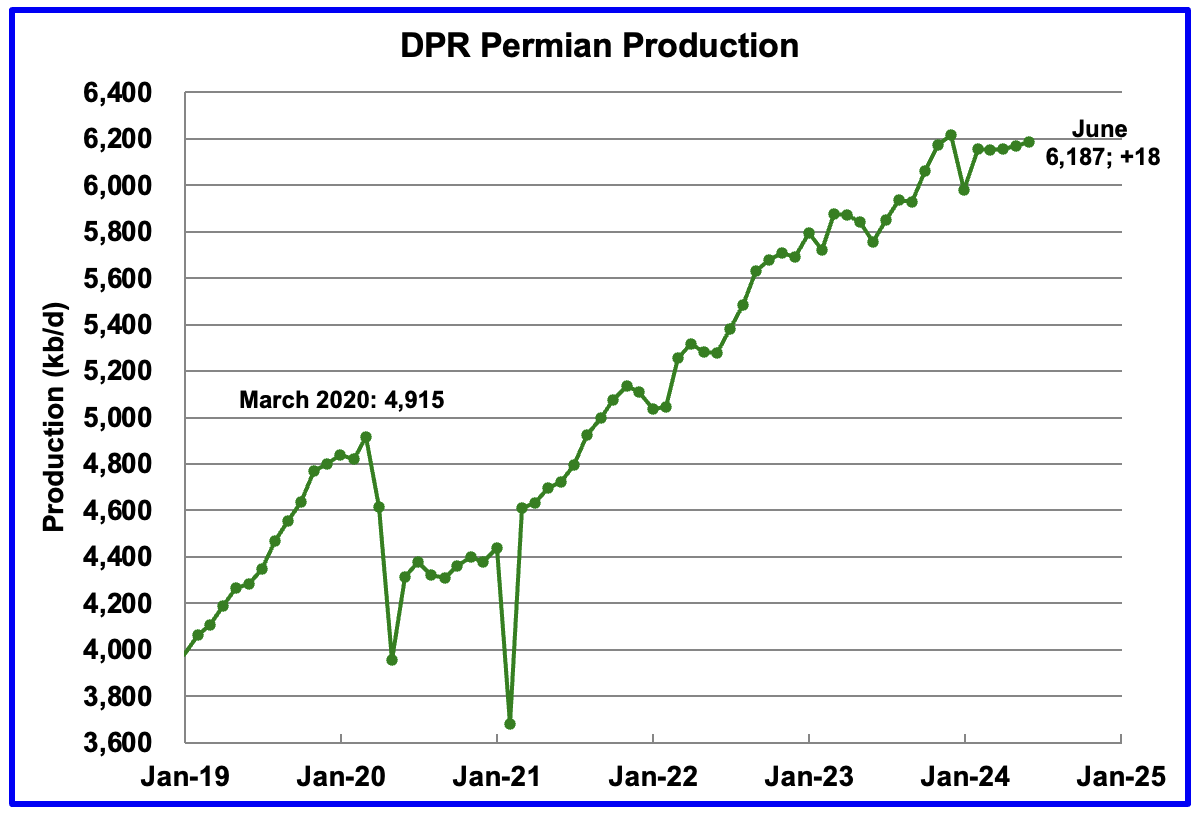
According to the EIA’s May DPR report, Permian output will continue its slow rise in June. It is expected to increase by 18 kb/d to 6,187 kb/d.
The last four months of Permian production show a slowly rising trend in monthly production. Production for the previous four months was essentially unchanged from the previous forecast.
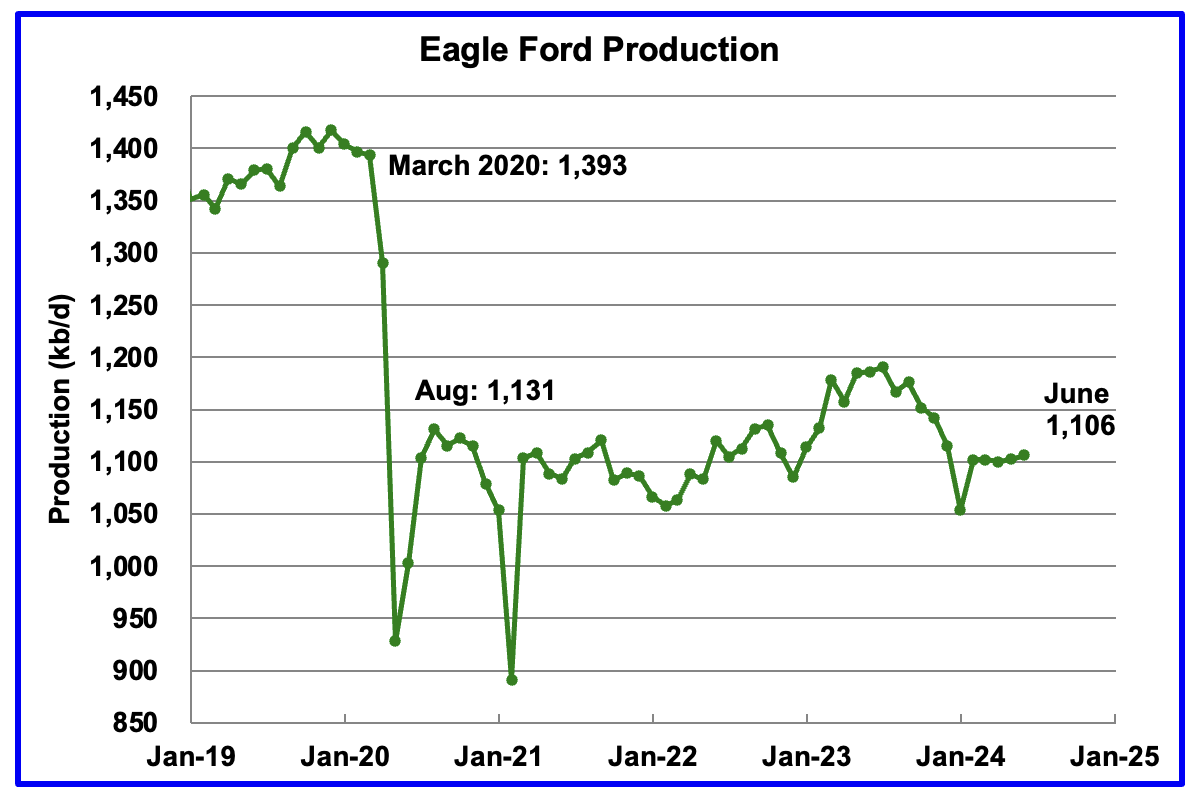
Output in the Eagle Ford basin has been on a plateau since March 2021. On that date production was 1,103 kb/d. The DPR’s May forecast projects June output will increase by 4 kb/d to 1,106 kb/d. However the STEO May forecast has made a downward revision to Eagle Ford production. May was revised down from 1,164 kb/d to 1,102 kb/d, a negative 62 kb/d revision.
Since the beginning of 2024, the Eagle Ford rig count has been close to 47 ± 2 rigs. The current rig count is 48 which may account for its relatively flat output.
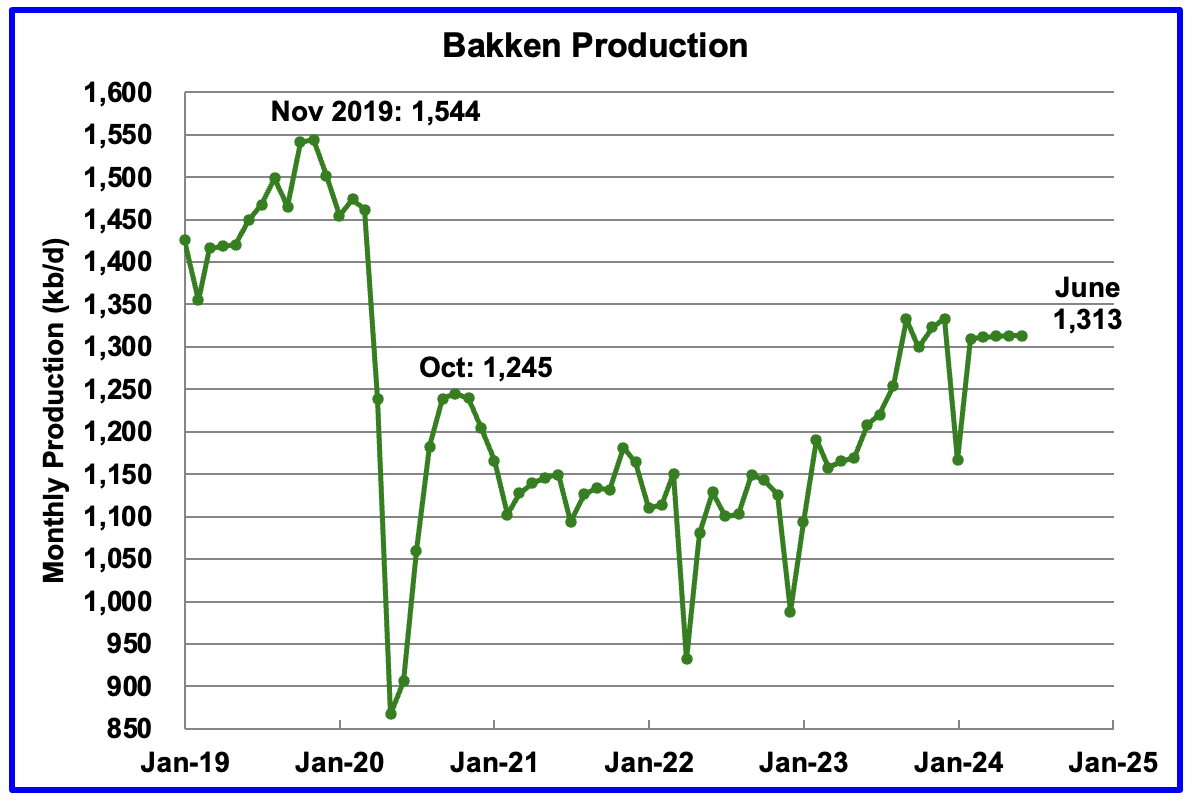
The DPR forecasts Bakken output in June will be 1,313 kb/d, unchanged from May. However May production has been revised up by 64 kb/d, so actually June production is up by 64 kb/d.
June 2024 production has now exceeded the 1,245 kb/d produced in October 2020 by 68 kb/d.
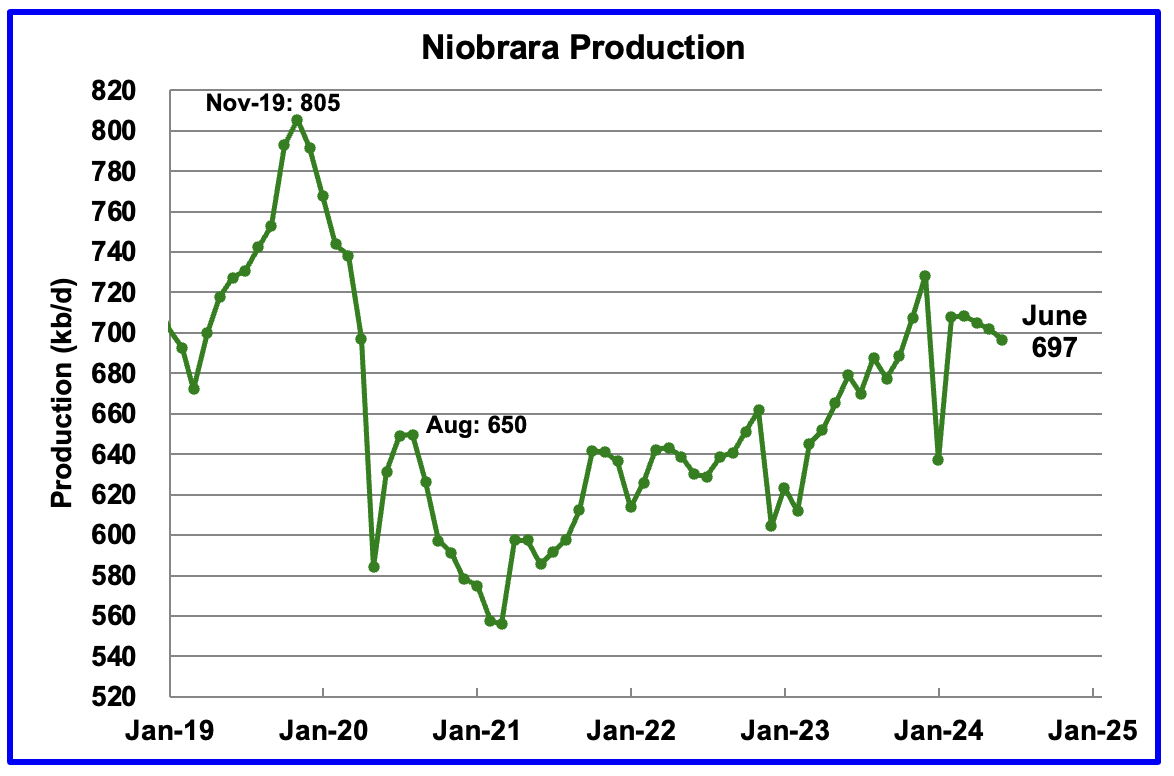
Output growth in the Niobrara continues to slow and has turned into a slow declining phase. June’s output decreased by 5 kb/d to 697 kb/d.
DUCs and Drilled Wells
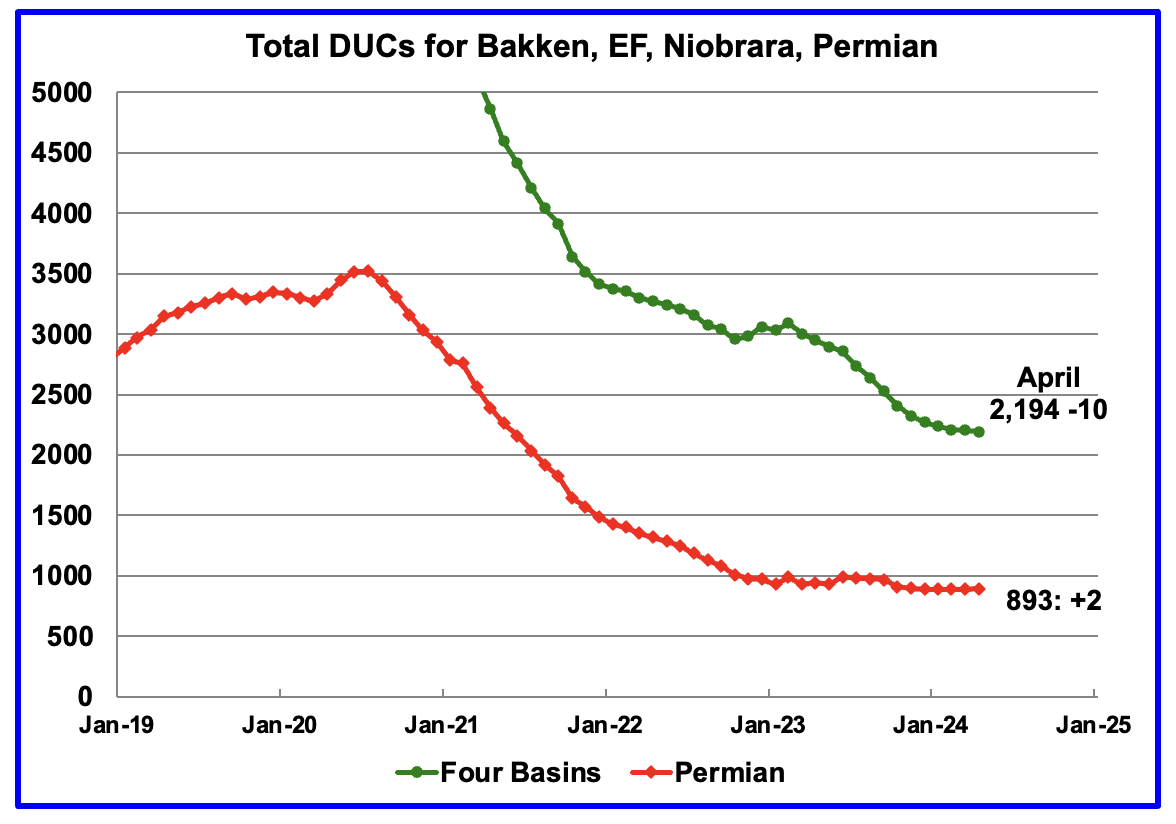
The number of DUCs available for completion in the Permian and the four major DPR oil basins has fallen every month since July 2020. April DUCs decreased by 10 to 2,194. In the Permian, the DUC count increased by 2 to 893, a rare event.
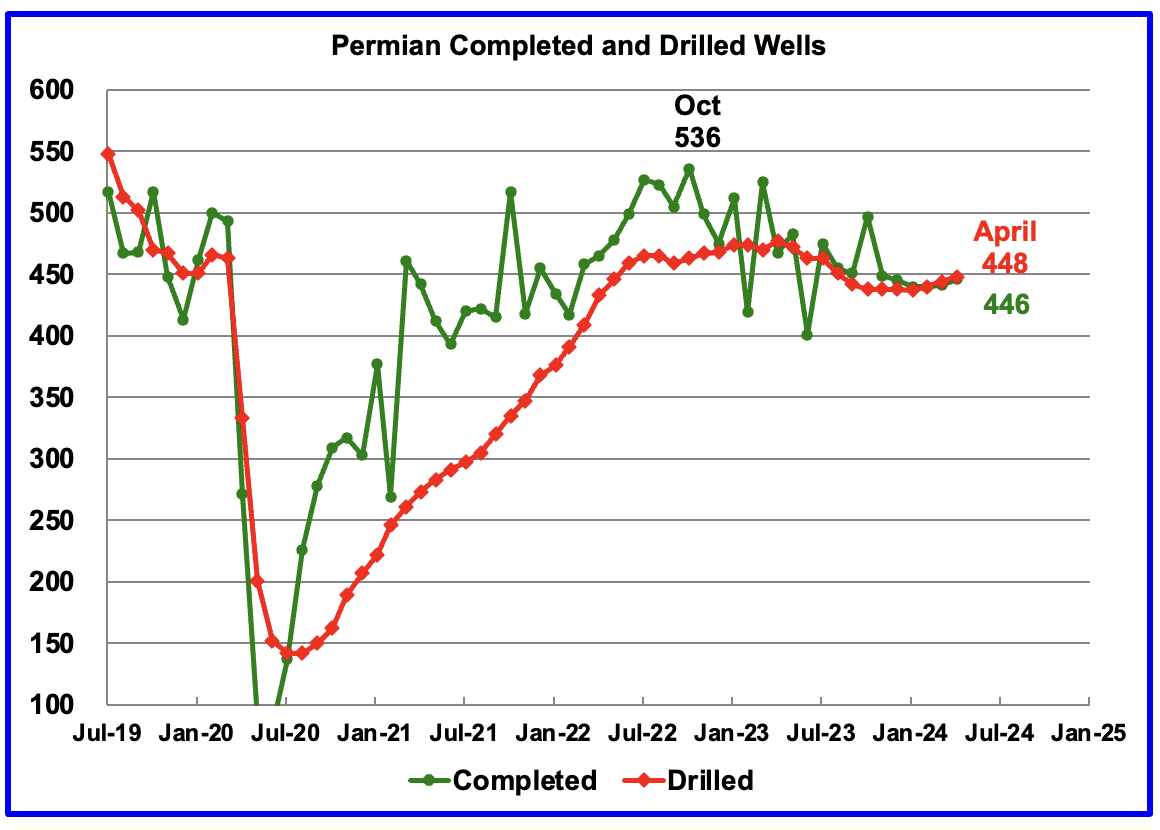
In the Permian, the monthly completion and drilling rates have been both stabilizing in the 440 to 450 range over the last six months.
In April 2024, 446 wells were completed while 448 new wells were drilled. This is the second month in almost a year where the number of wells drilled exceeded the completions.