A Guest Post by Ovi
All of the Crude plus Condensate (C + C) production data for the US state charts comes from the EIAʼs January Petroleum Supply monthly PSM which provides updated information up to November 2022.
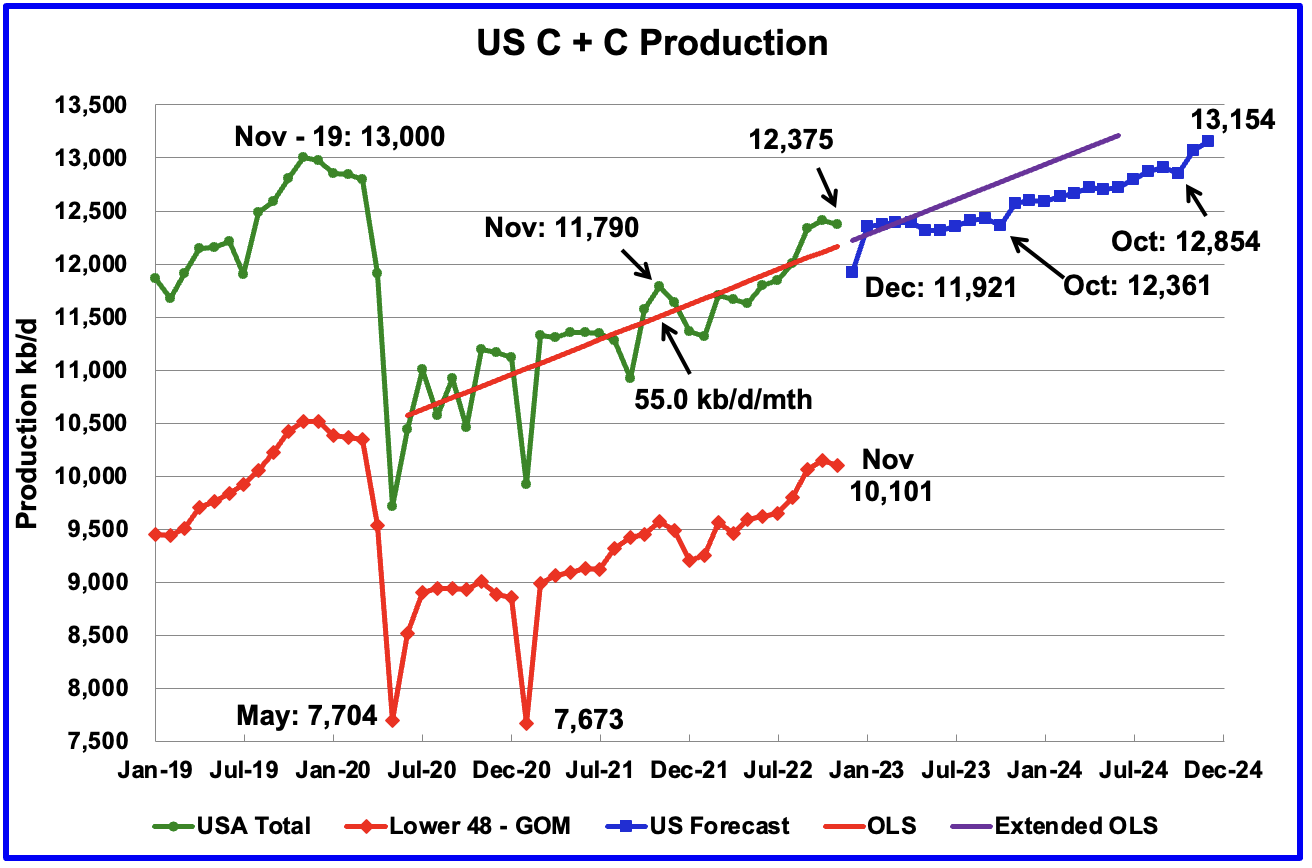
U.S. November production decreased by 35 kb/d to 12,375 kb/d. For November, the state with the largest increase was Oklahoma with 19 kb/d while North Dakota had the largest decrease, 23 kb/d. The GOM also experienced a production drop.
While overall US oil production decreased by 35 kb/d, the Onshore L48 had a larger drop of 50 kb/d to 10,101 kb/d. This means that the source for the largest US production decrease came from the Onshore L48.
The blue graph, taken from the January 2023 STEO, is the production forecast for the U.S. from December 2022 to December 2024. Output for December 2024 is expected to be 13,154 kb/d which would exceed the November 2019 peak of 13,000 kb/d.
Note that production in October 2023 is forecast to be lower than November 2022. The flatness in overall US output up to October 2023 is due to the production increase in the Onshore L48 from December 2022 to October 2023 being offset by declining production in the GOM. See GOM chart further down.
The red OLS line from June 2020 to November 2022 indicates a monthly production increase of 55.0 kb/d/mth over that period. The first portion of red line stops at November because that is the range covered by the OLS analysis. The second portion is the same OLS line extended to see how well it fits the STEO forecast. The growth rate for 2023 and 2024 is expected to be lower than the 55 kb/d/mth seen from July 2020 to November 2023.
Oil Production Ranked by State
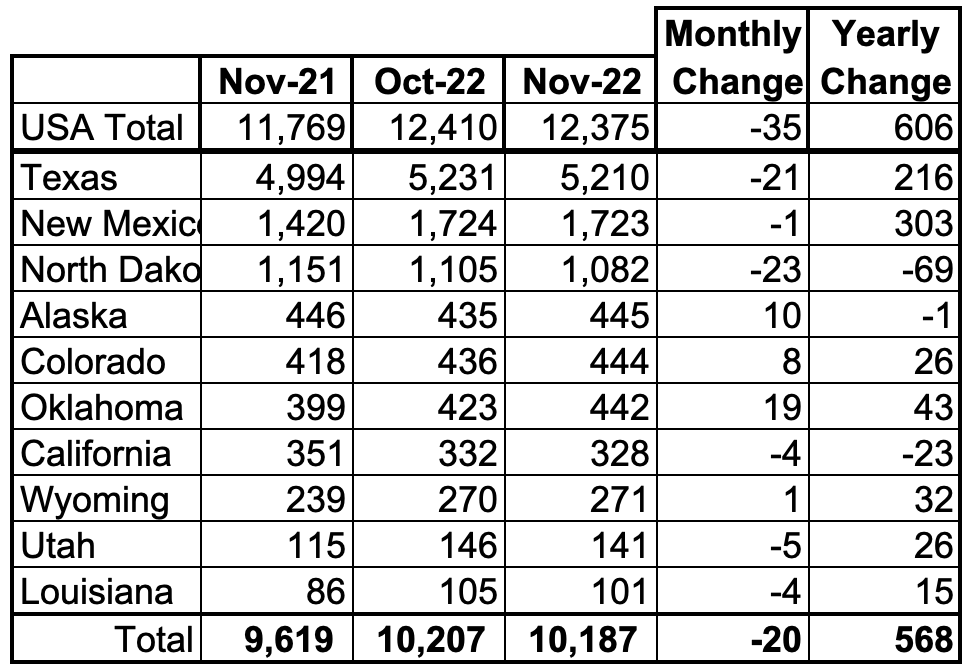
Listed above are the 10 states with the largest US production. These 10 accounted for 82.3% of all U.S. oil production out of a total production of 12,375 kb/d in November 2022.
On a YoY basis, US production increased by 606 kb/d with the majority, 519 kb/d having come from Texas and New Mexico.
State Oil Production Charts
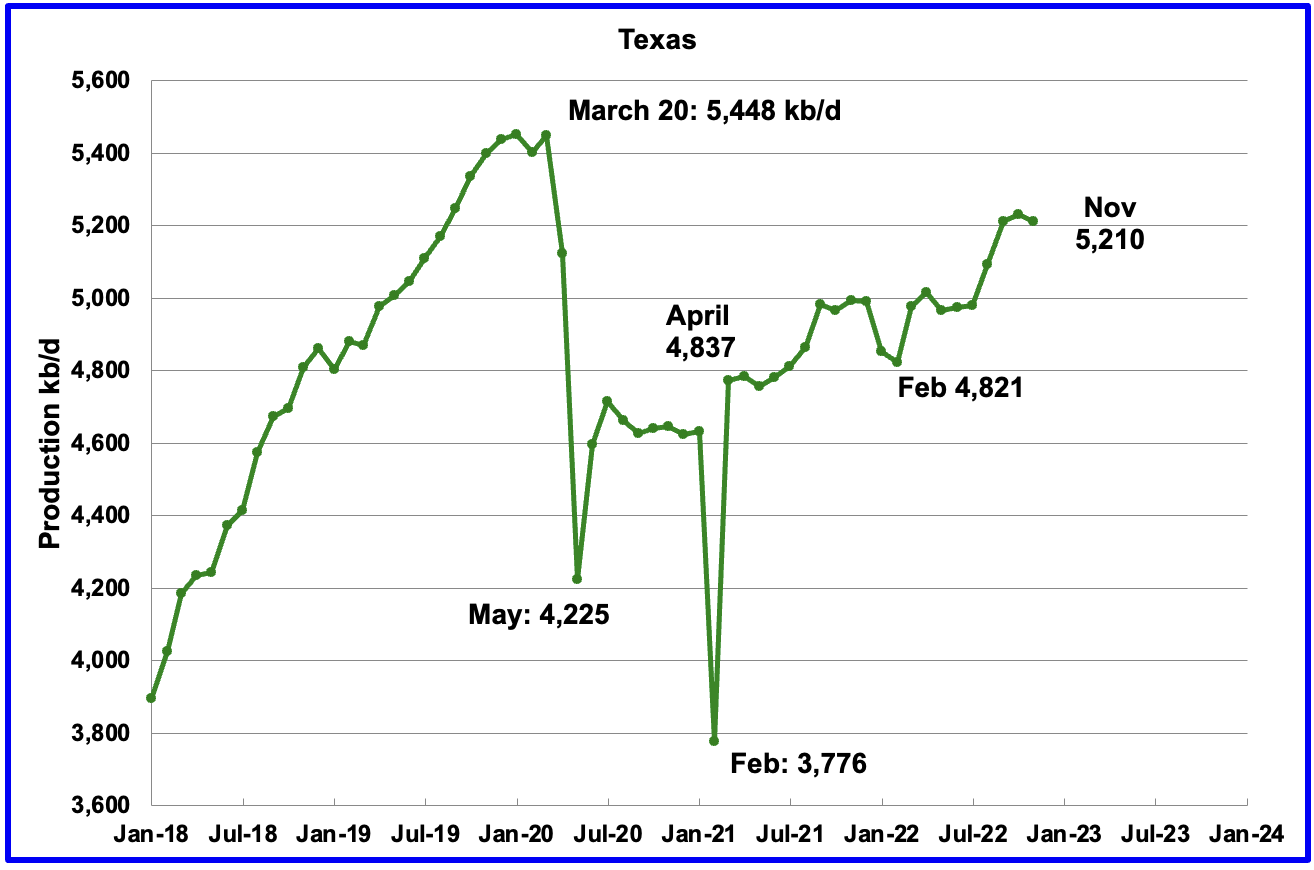
Texas production decreased by 21 kb/d in November to 5,210 kb/d. The decrease is due to October being revised up by 35 kb/d from 5,196 kb/d to 5,231 kb/d in the previous report.
In October 2021 there were 215 Hz oil rigs operating in Texas. By November 2022, 319 Hz oil rigs were operational, an increase of 104 rigs.
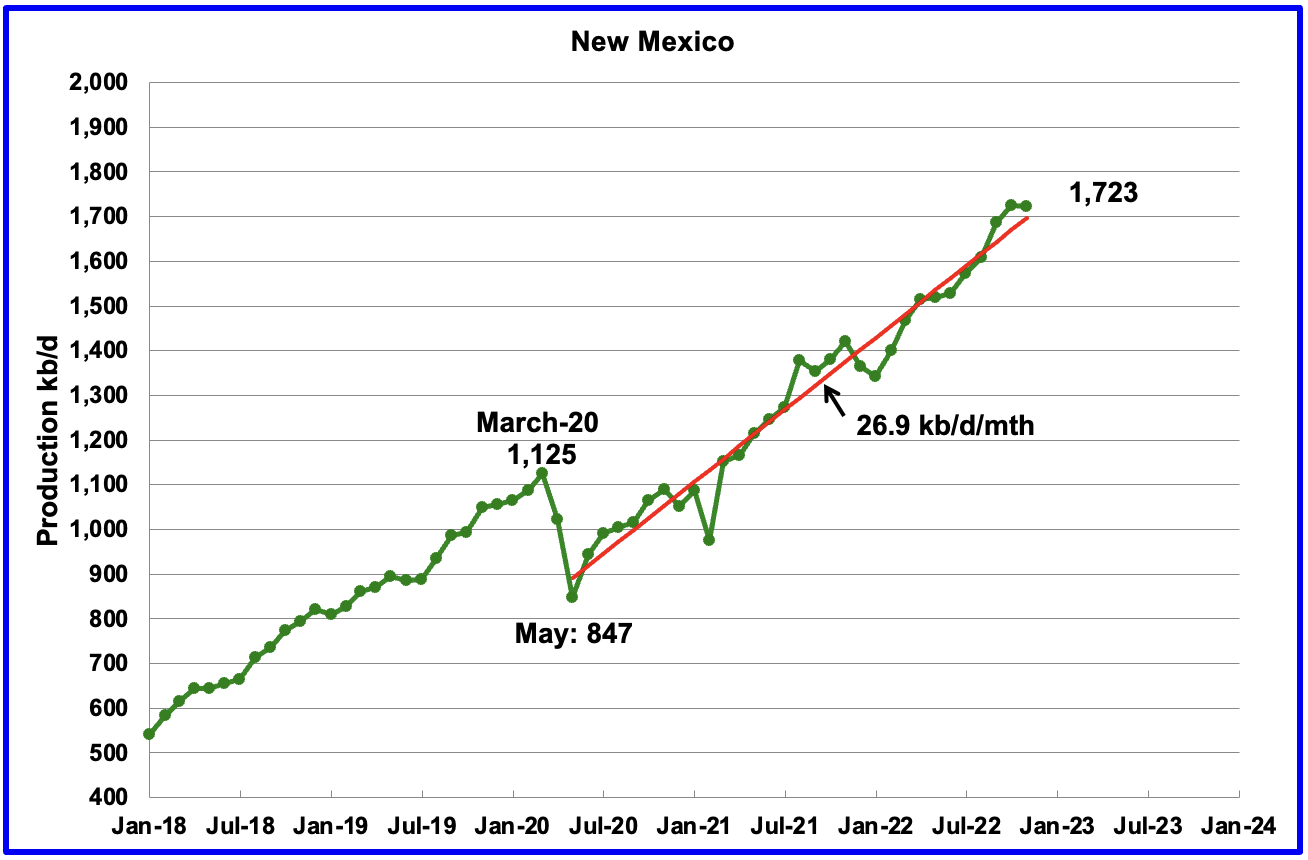
November’s New Mexico production was essentially flat at 1,723 kb/d, a decrease of 1 kb/d. The red OLS line from May 2020 to November 2022 indicates a production growth rate of 26.9 kb/d/mth and shows no sign of rolling over. Since August, the rig count has been steady in the high 90s, 97 ±4.
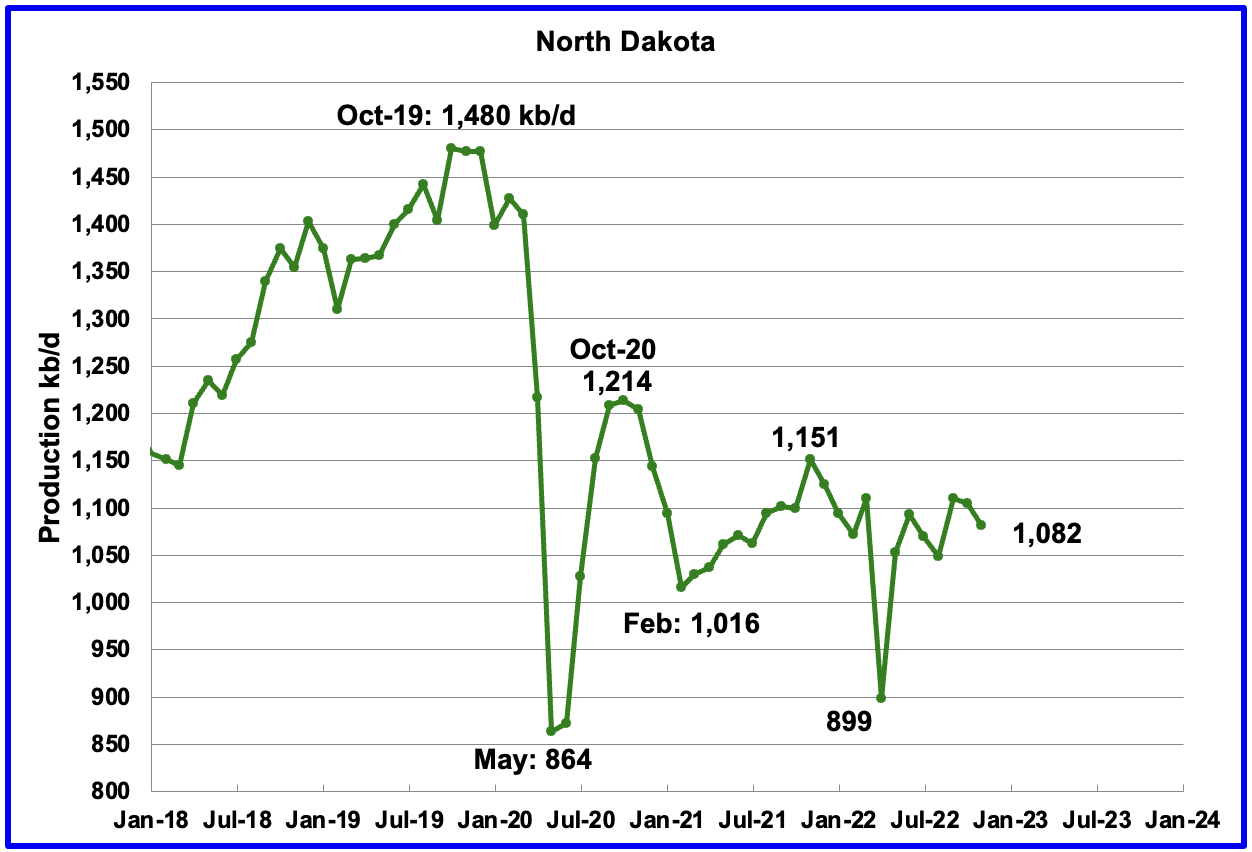
North Dakota’s November output decreased to 1,082 kb/d, a decrease of 23 kb/d from October.

Alaskaʼs October output increased by 10 kb/d to 445 kb/d and was 1 kb/d lower than November 2022. This is an early indication that Alaska may be breaking out from the red declining downtrend line. Note how the summer lows are also higher.
According to this report, the Biden administration has agreed to advance the controversial Willow oil drilling project in Alaska.
“Erec Isaacson, president of ConocoPhillips Alaska, said in a statement that nearly five years of regulatory review should conclude “without delay.” Isaacson added the project is “ready to begin construction immediately” after Interior’s final decision is issued.”
On the other hand, “The world and the country can’t afford to develop that oil,” said Jeremy Lieb, a senior attorney for environmental law firm Earthjustice. Lieb and other advocates are concerned that Willow may be the start of a future drilling boom in the area.
You can’t keep everybody happy.
Conoco Philips states that the Willow project could produce up to 180 kb/d. Another article states 130 kb/d.
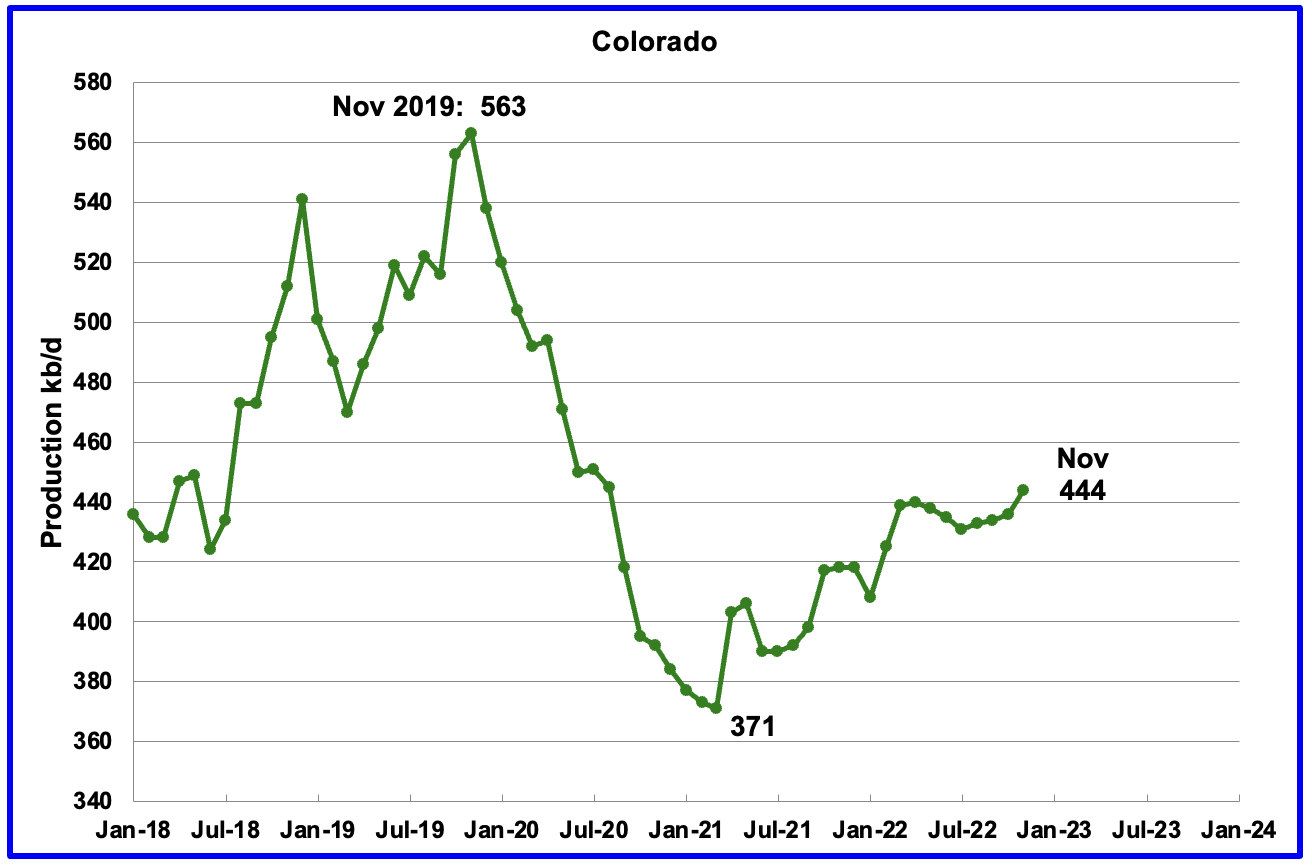
Coloradoʼs November production increased by 8 kb/d to 444 kb/d.
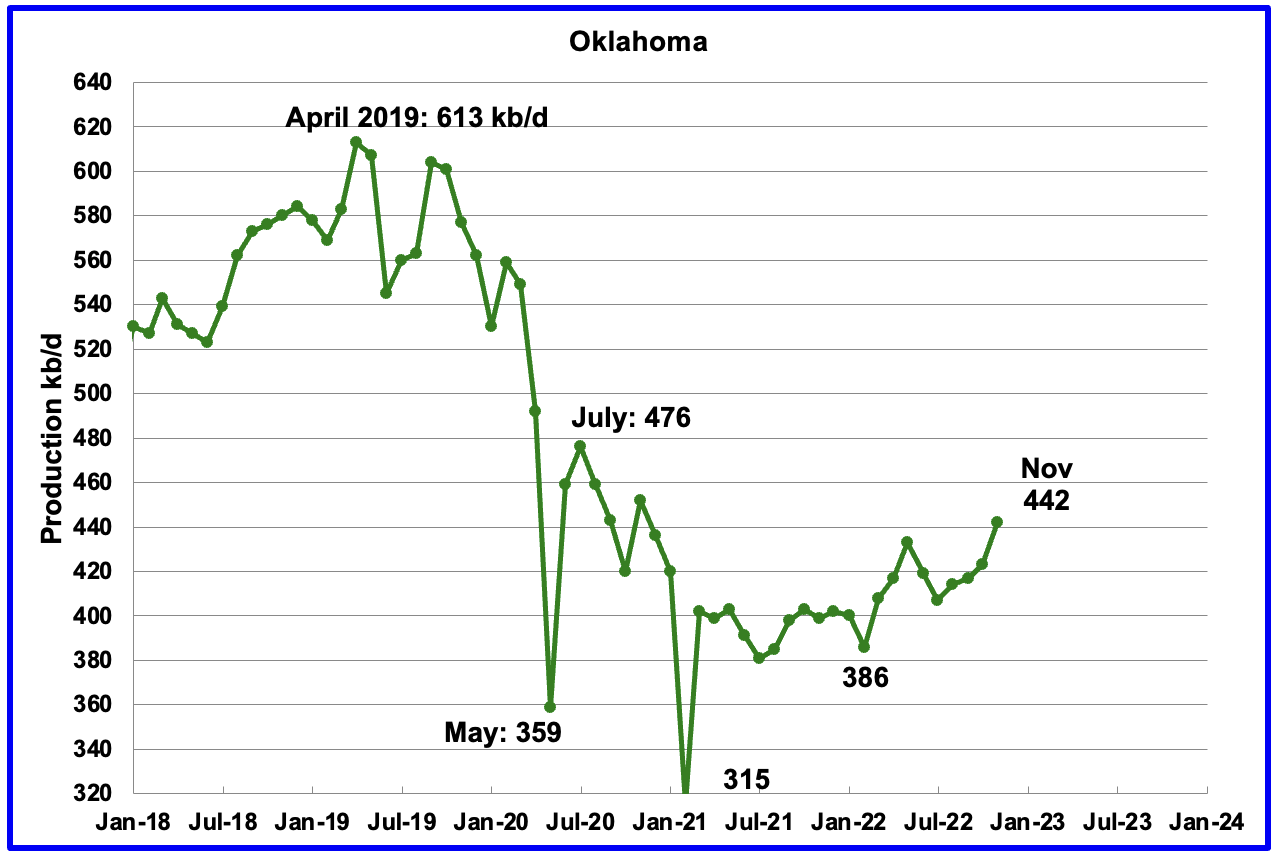
Oklahoma’s output in November increased by 19 kb/d to 442 kb/d. From January 2022 to April 2022, close to fifty rigs were operating in Oklahoma. By late November the rig count had increased to 69.
Production remains 34 kb/d below the post pandemic high of 476 kb/d.
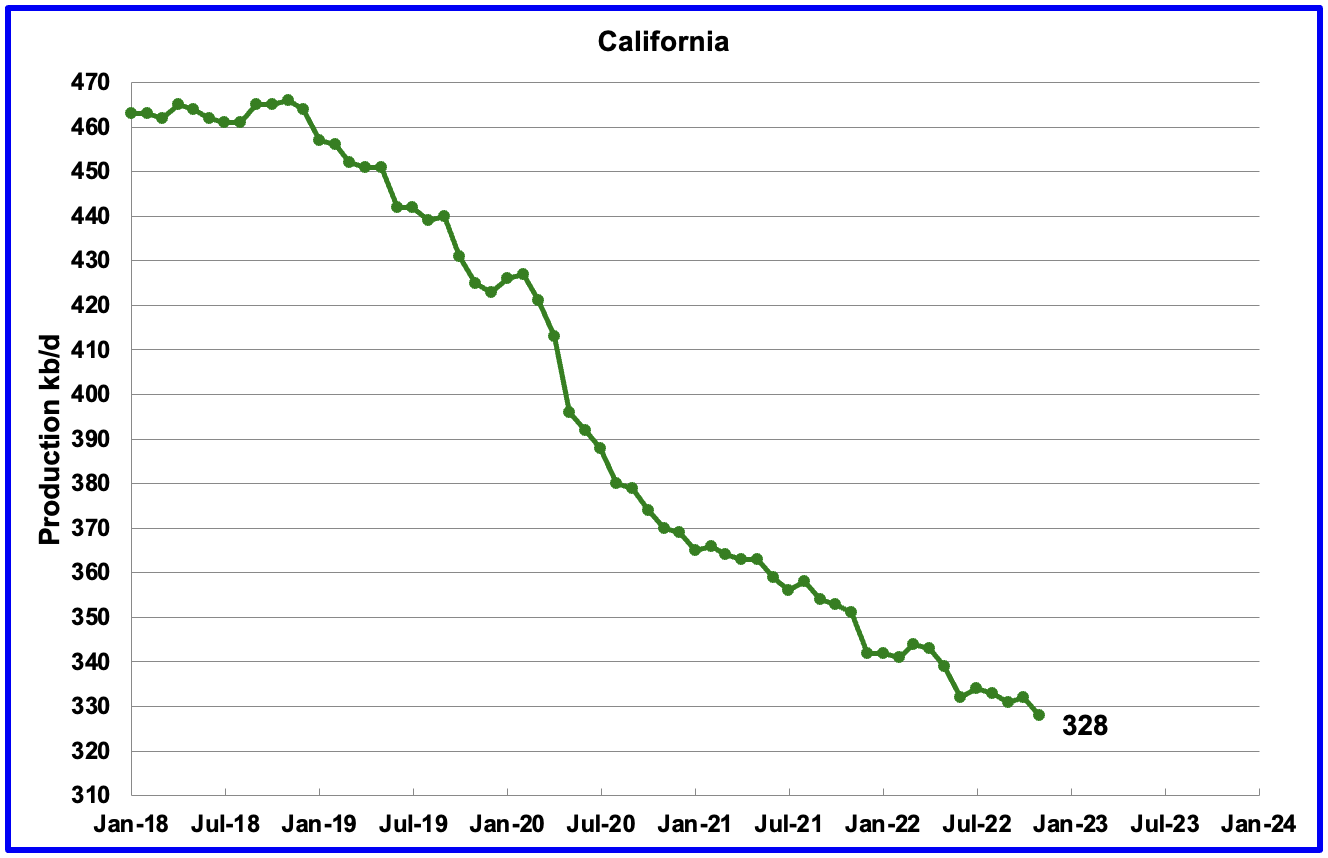
Californiaʼs overall slow output decline trend continues. November production decreased by 4 kb/d to 328 kb/d.
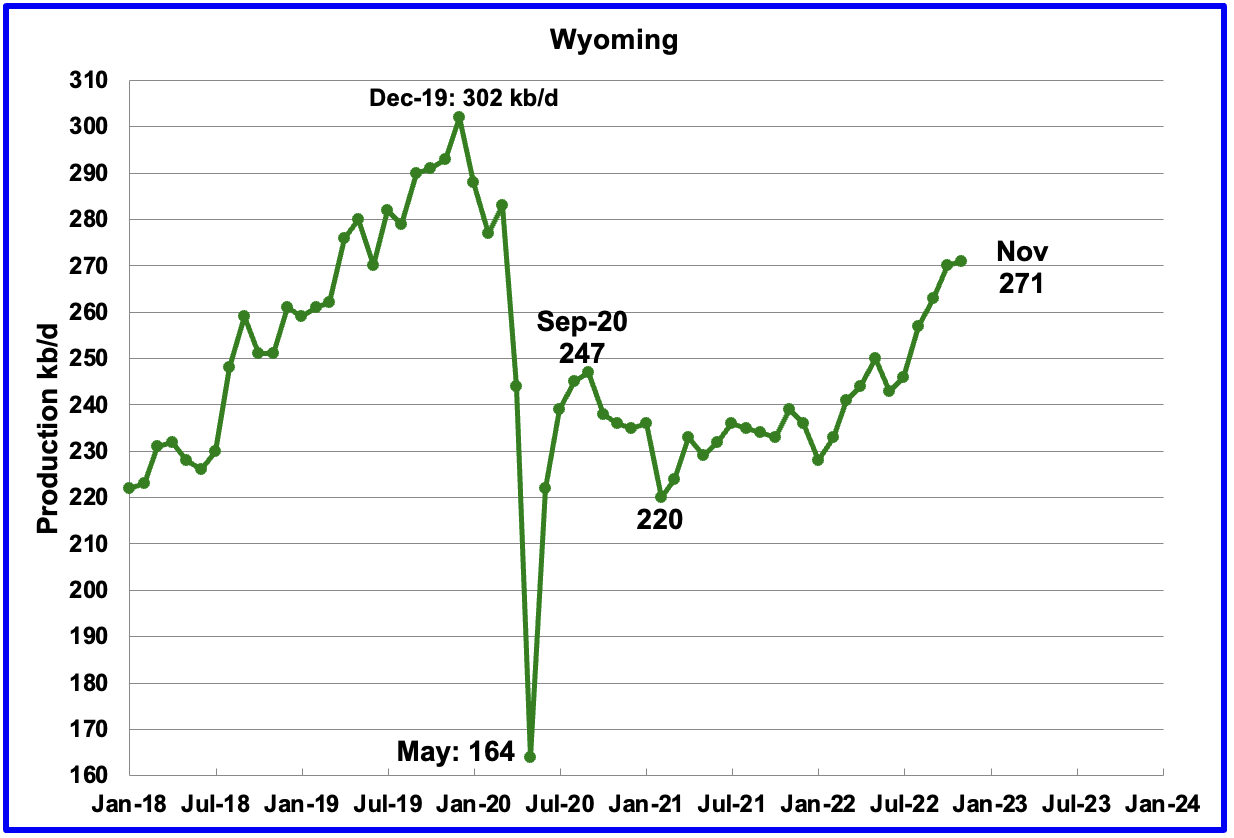
Wyoming’s oil production has been on a slow unsteady uptrend from the low of 220 kb/d in February 2021 due to increased drilling. November’s output reached a new post pandemic high of 271 kb/d, an increase 1 kb/d over October.
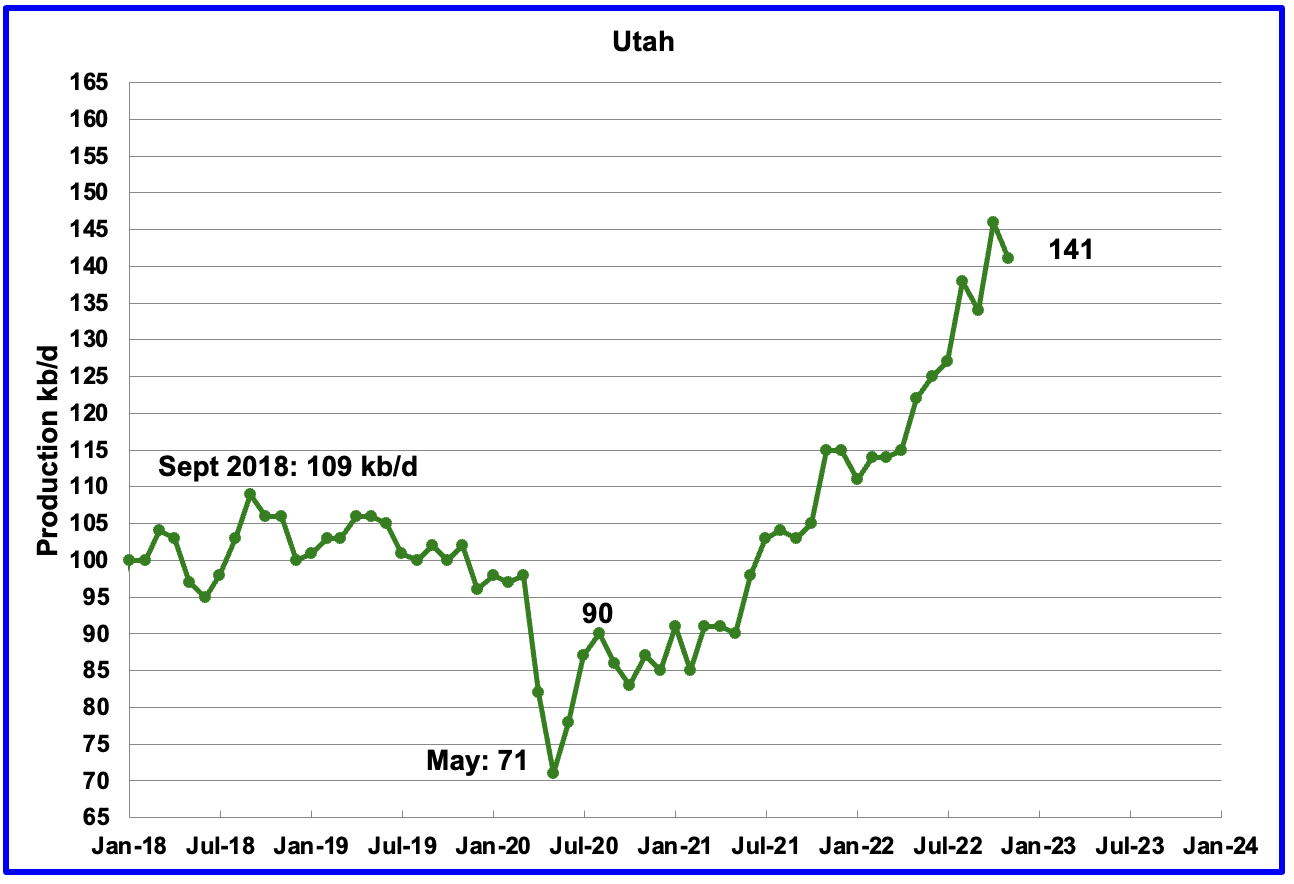
Utah’s oil production had been increasing steadily since January 2022. However November saw production drop by 5 kb/d to 141 kb/d. Utah had 8 Hz rigs operating in November, up from 5 in January 2022.
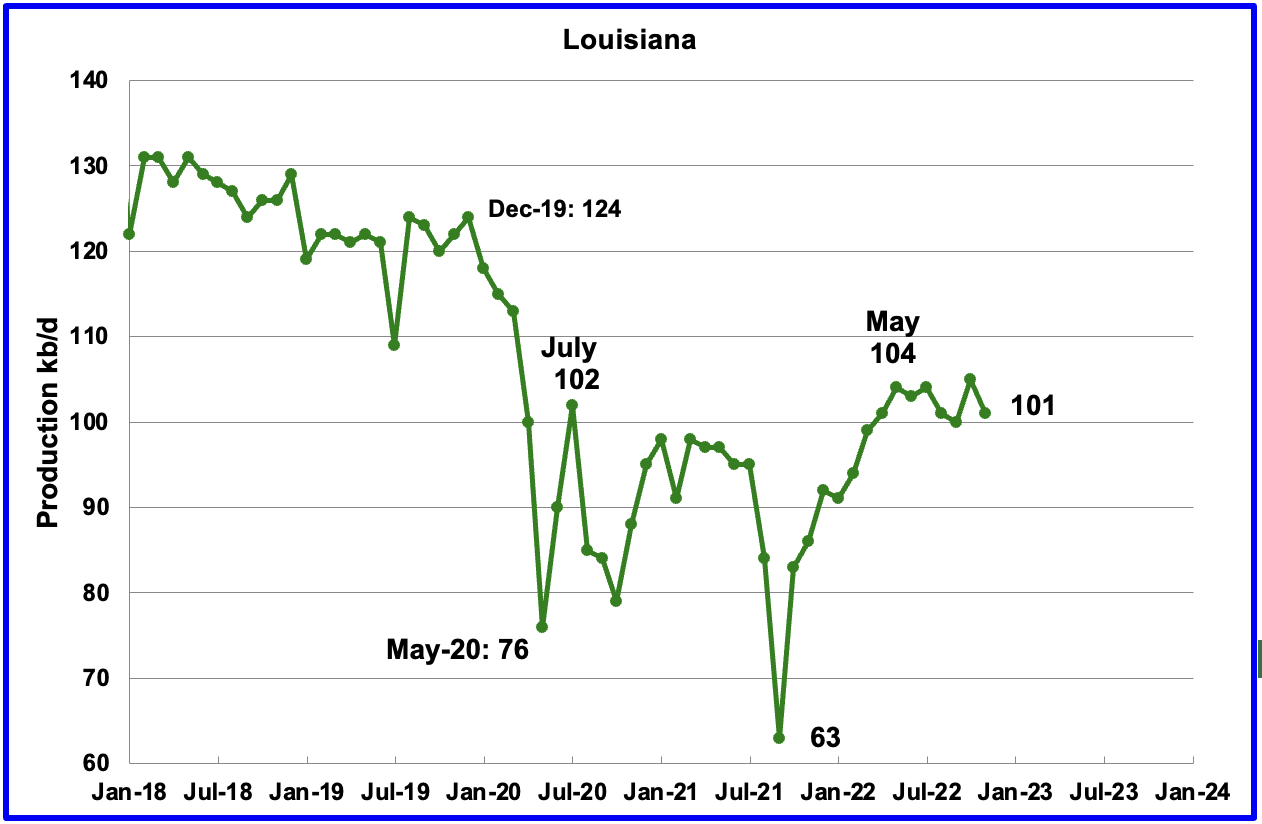
Louisiana’s output rose from the low of 63 kb/d in September 2021 to 104 kb/d in May 2022. Since then output has plateaued. November’s output decreased by 4 kb/d to 101 kb/d.
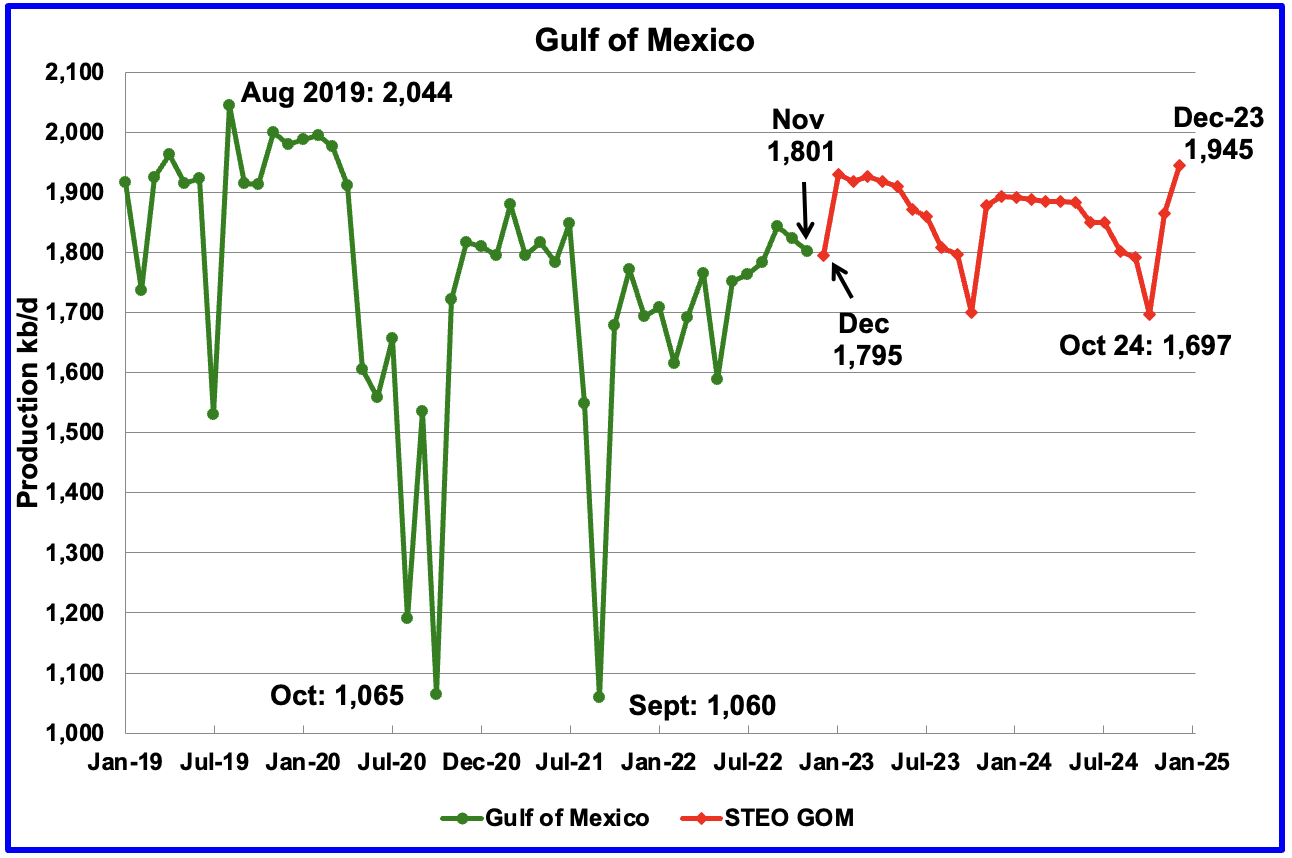
GOM production dropped by 23 kb/d in November to 1,801 kb/d. If the GOM was a state, its production would normally rank second behind Texas.
The January 2023 STEO projection for the GOM output has been added to this chart and projects output will be 1,945 kb/d in December 2024. The production decline in 2023 is due to decline in existing GOM fields not being offset by the increases in crude oil production from the new fields mentioned below. The large spike in January may be due to the startup of the Vito platform.
In an August update, Equinor states that Vito startup has been delayed till early 2023. Shell confirms that the start-up of production at its Vito platform in the US Gulf of Mexico will slip into the first quarter of 2023.
According to this source, the EIA expects nine new Gulf of Mexico fields to start production this year. The fields expected to come online this year include those at Argos/Mad Dog 2, Vito, Lobster, Dome Patrol, Olympus, Taggart, and the Kings Quay fields. The EIA noted that the large development fields at Argos/Mad Dog 2, King’s Quay, and Vito each has a peak production capacity of 100,000 barrels of oil equivalent per day or more.
A Different Perspective on US Oil Production
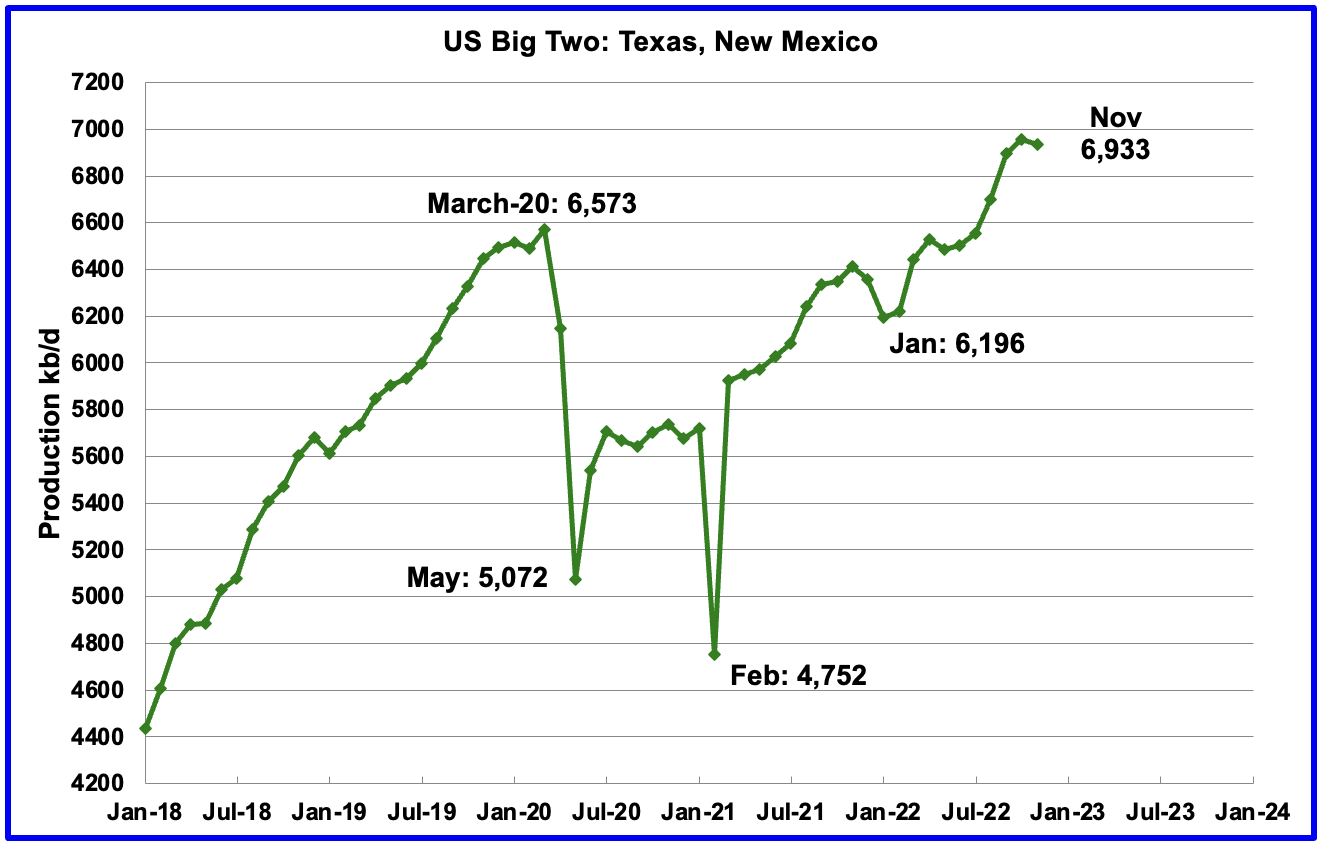
The Big Two states, combined oil output for Texas and New Mexico.
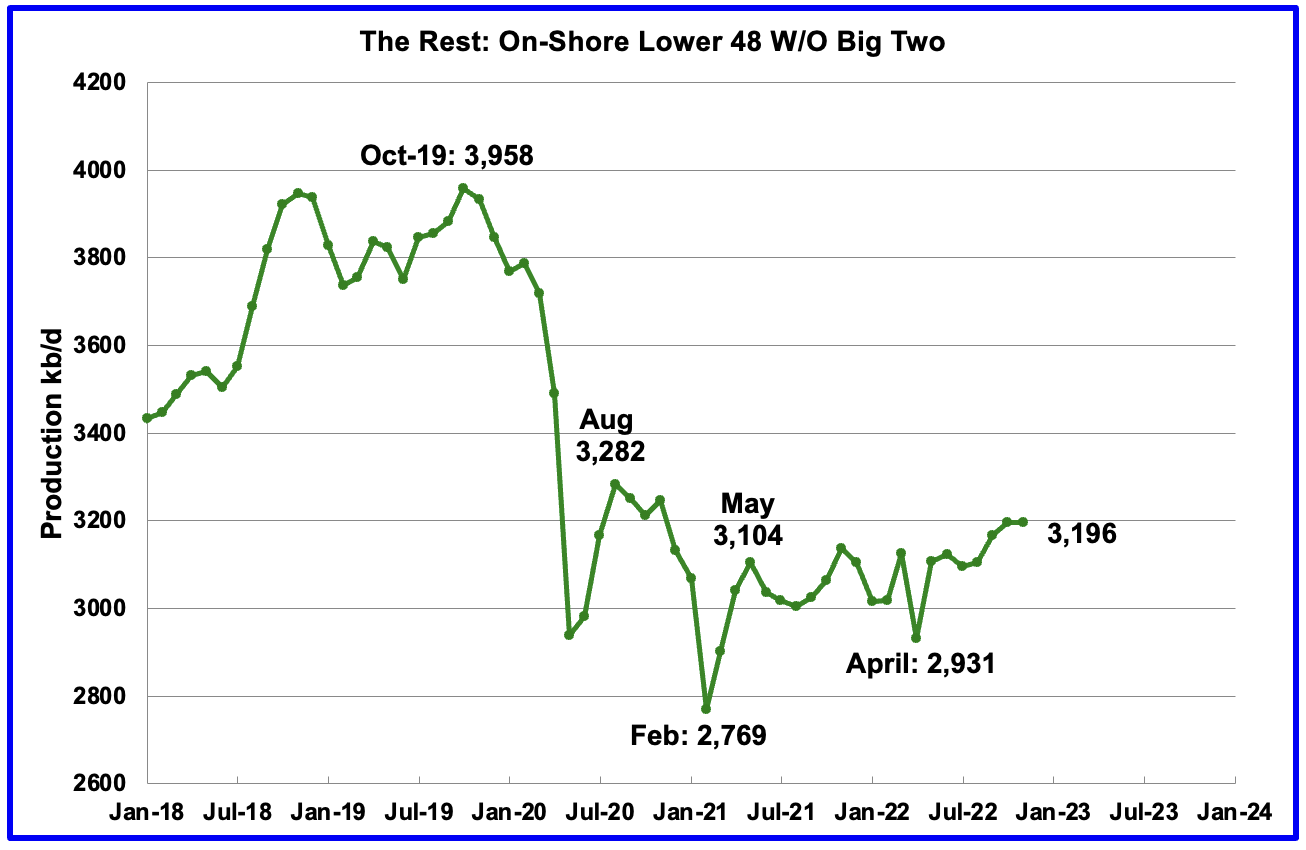
Oil production by The Rest
November’s production in the Big Two states decreased by a combined 22 kb/d to 6,933 kb/d with Texas dropping 21 kb/d and New Mexico dropping 1 kb/d. In November production in The Rest was unchanged at 3,196 kb/d.
The main thing to notice in the Rest Chart is that current production is 762 kb/d below the high of October 2019. The question we need answered Is “Is this a permanent loss that will never be recovered?” I think it is a permanent loss.
Comparing May 2021 output with November 2022 output, the Rest have added 92 kb/d to US output, indicating a period of slowly increasing production .
Rigs and Fracs
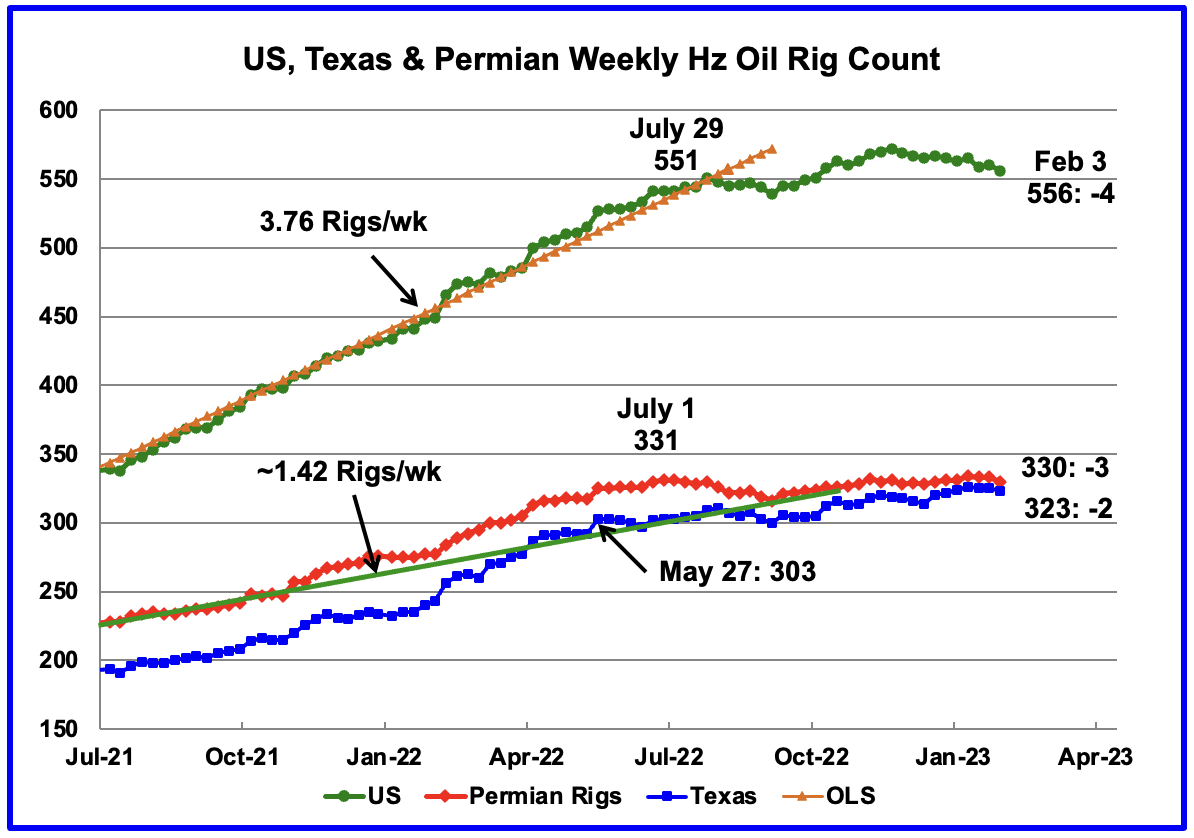
Since the beginning of April 2021 through to the week ending July 29, 2022, the US added horizontal oil rigs at a rate of close to 3.82 rigs/wk, orange OLS line, and peaked at 551 rigs in the week ending July 29. However since then the number of operational rigs has wondered sideways. In the week ending February 3, the number of rigs decreased by 4 to 556, 5 higher than July 29, 2022.
In the week ending February 3, Permian rigs dropped by 3 to 330 and Texas rigs dropped by 2 to 323. Note that Permian rigs are are at the same level as July 1.
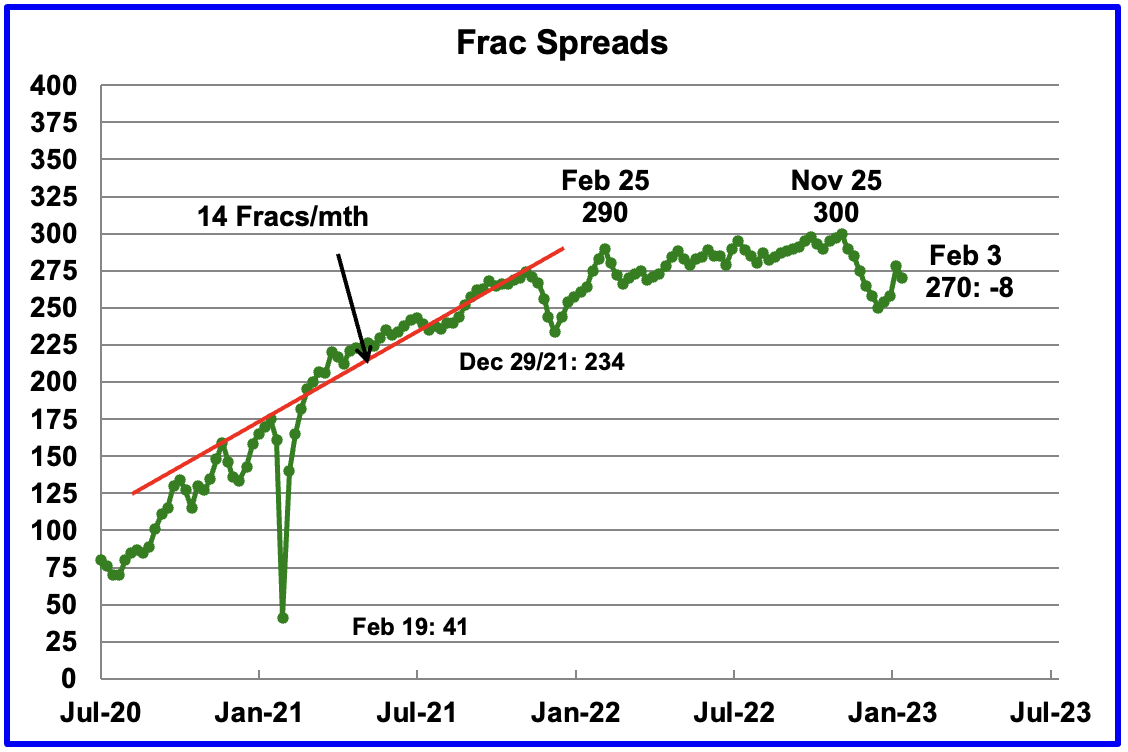
For frac spreads, the general trend since late February 2022 can best be described as essentially flat around the 290 level but with a hint of a slow increase toward 300 frac spreads. At the beginning of the 2022 Thanksgiving and Christmas holidays, the frac count began to drop. The frac count bottomed in the week ending January 6 at 250 and then began to recover. A similar trend occurred last year.
For the week ending January 27, the Frac count increased by 20 which was then followed by a drop of 8 to 270 for the current week ending February 3. Was the 20 increase a counting error?
Note that these 270 frac spreads include both gas and oil spreads.
Drilling Productivity Report
The Drilling Productivity Report (DPR) uses recent data on the total number of drilling rigs in operation along with estimates of drilling productivity and estimated changes in production from existing oil wells to provide estimated changes in oil production for the principal tight oil regions. The January DPR forecasts production to February 2023 and the following charts are updated to February 2023.
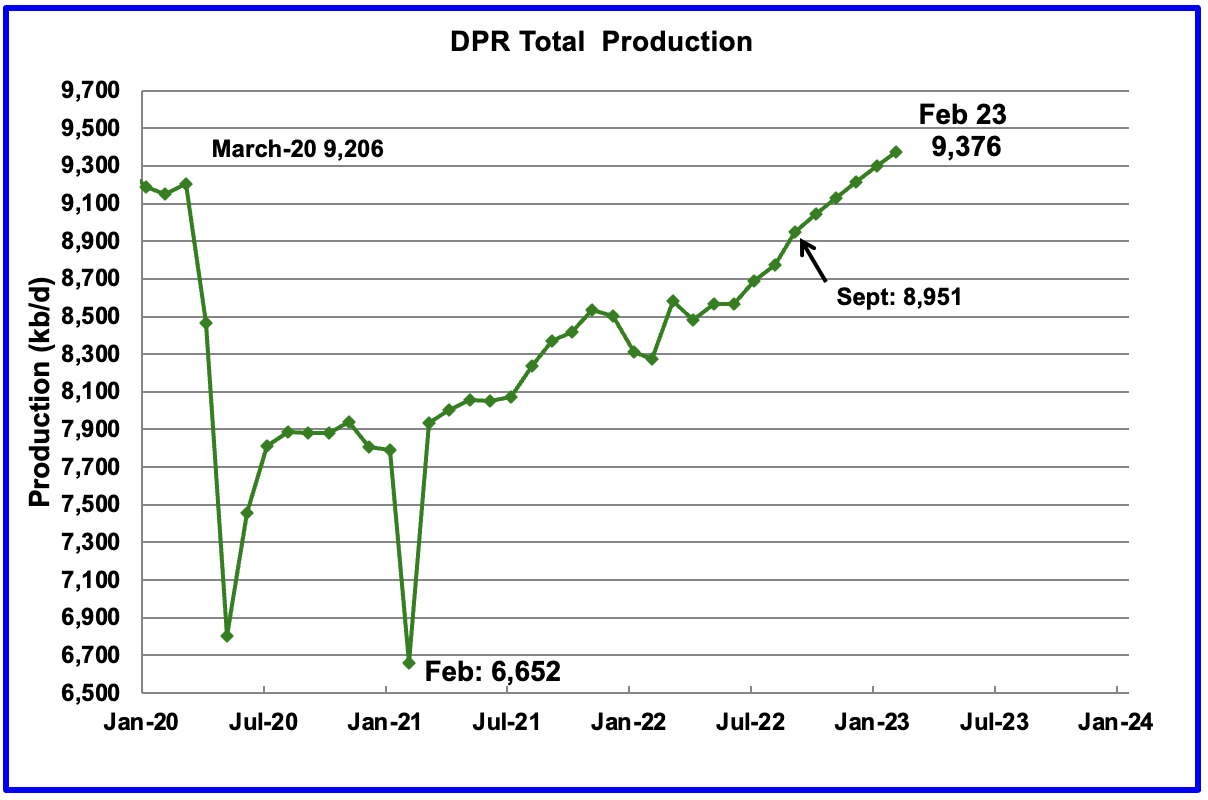
Above is the total oil production projected to February 2023 for the 7 DPR basins that the EIA tracks. Note that DPR production includes both LTO oil and oil from conventional wells.
The January DPR report made made minimal revisions to the the December report. For instance, January output was revised down by just 20 kb/d. The DPR is projecting that oil output for February 2023 will increase by 78 kb/d to 9,376 kb/d or 58 kb/d relative to the original December report. February’s output is projected to be 172 kb/d higher than the pre-pandemic high of 9,206 kb/d.
From September 2022 to February 2023, output in the DPR basins is forecast to increase by 425 kb/d or by an average growth rate of 85 kb/d/mth. This rate is lower than reported in previous posts which were greater than 100 kb/d.
This high growth rate is almost double the rate, 54.5 kb/d/mth, shown in the LTO report in the next section. It is not clear why there is such difference between these two reports.
It should be noted that questions are raised regarding the methodology used by the DPR to project their production forecasts.

This chart shows the monthly DPR production increments. What is notable is the reduced month to month volatility since September 2022. Is this another indication of a planned monthly drilling and completion program by company management to meet financial commitments, regardless of the price volatility of U.S. oil.
According to this source: “US shale producers in particular are struggling with supply chain constraints, cost inflation and capital discipline, the IEA said noting that: “This casts doubt on suggestions that higher prices will necessarily balance the market through additional supply.”
According to OPEC, the global oil industry needs to add 5 million b/d of new production capacity each year to offset natural declines, with a total of $12.1 trillion in spending needed through 2045.”
That decline rate of 5 Mb/d is ten times higher than the decline rate in the 50 small countries tracked by the author.
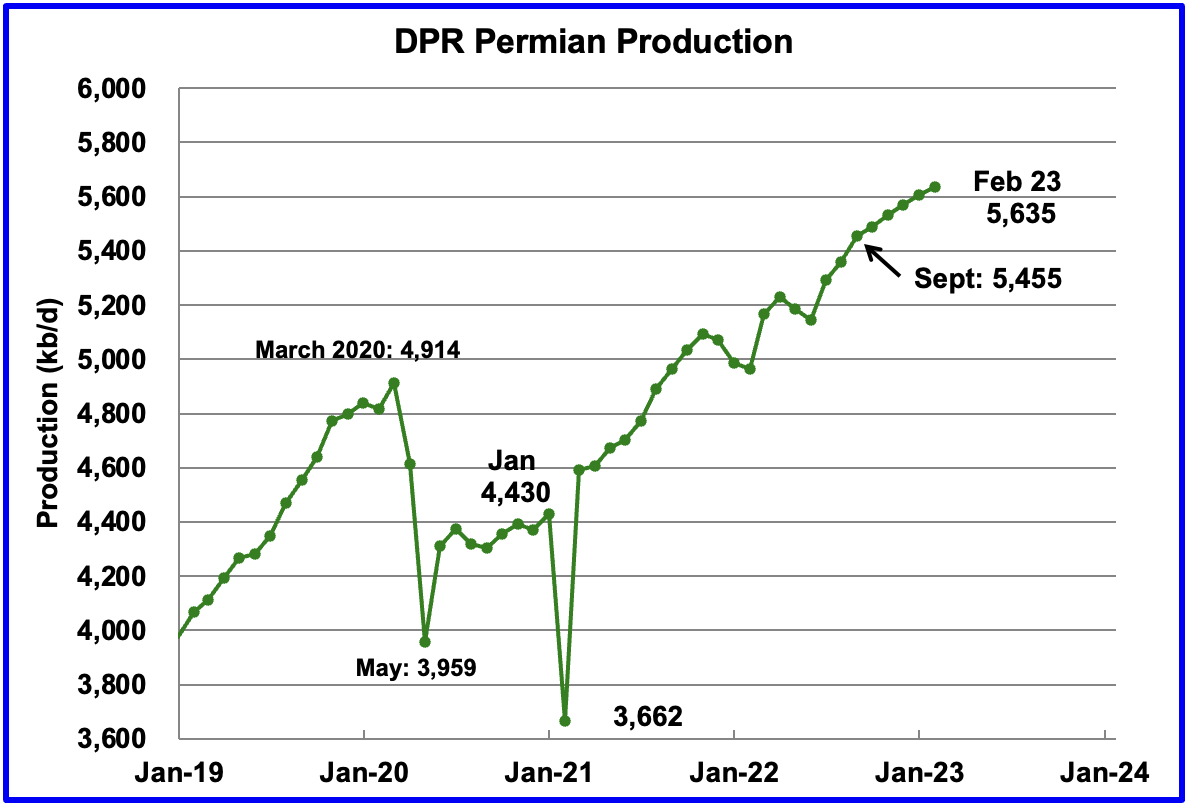
Permian output continues to rise in February. Production is expected to increase by 30 kb/d to a new high of 5,635 kb/d. From September to February, production is forecast to increase by 180 kb/d or at an average rate of 36 kb/d/mth which is lower than rates from earlier this year. Production since September hints at slowing monthly production increases, possibly more related to capital discipline than geology.
If the Permian were part of OPEC, at 5,635 kb/d it would be the second largest producer after Saudi Arabia.
During December, 432 wells were drilled and 431 were completed in the Permian. (Note that December is the latest month for DUC information). The completed wells added 367 kb/d to December’s output for an average of 852 b/d/well. The overall decline was 329 kb/d which resulted in a net increase for Permian output of 38 kb/d. Of the 431 completed wells, 386 were required to offset the decline.
Note, this is the first month in which no DUCs were used in the Permian, actually one was added.
An Exxon spokesman made the following comment regarding their Permain DUCs:
“If you look at 2021, we added about 90,000 barrels a day of production. 2022, very similar number, 90,000 barrels a day. And that, in part, was what I’d call the organic development and the drilling and the production, as well as clearing our DUCs inventory. So, as we were in the pandemic, obviously, not a lot of incentive to bring production on.
And so, we concentrated our spend on drilling. And then as we got into higher-priced environments, concentrated on clearing that inventory and bringing those wells to production. And so, we were bringing our DUC inventory down. As we go into next year, we’re going to rebuild that inventory, get to an optimum level that we can then use and maintain as we go through the next several years.”
So what is the strategy going forward. Spend extra cash to rebuild the DUCs inventory, rank them, and complete a mix of wells to optimize/control output and profits?
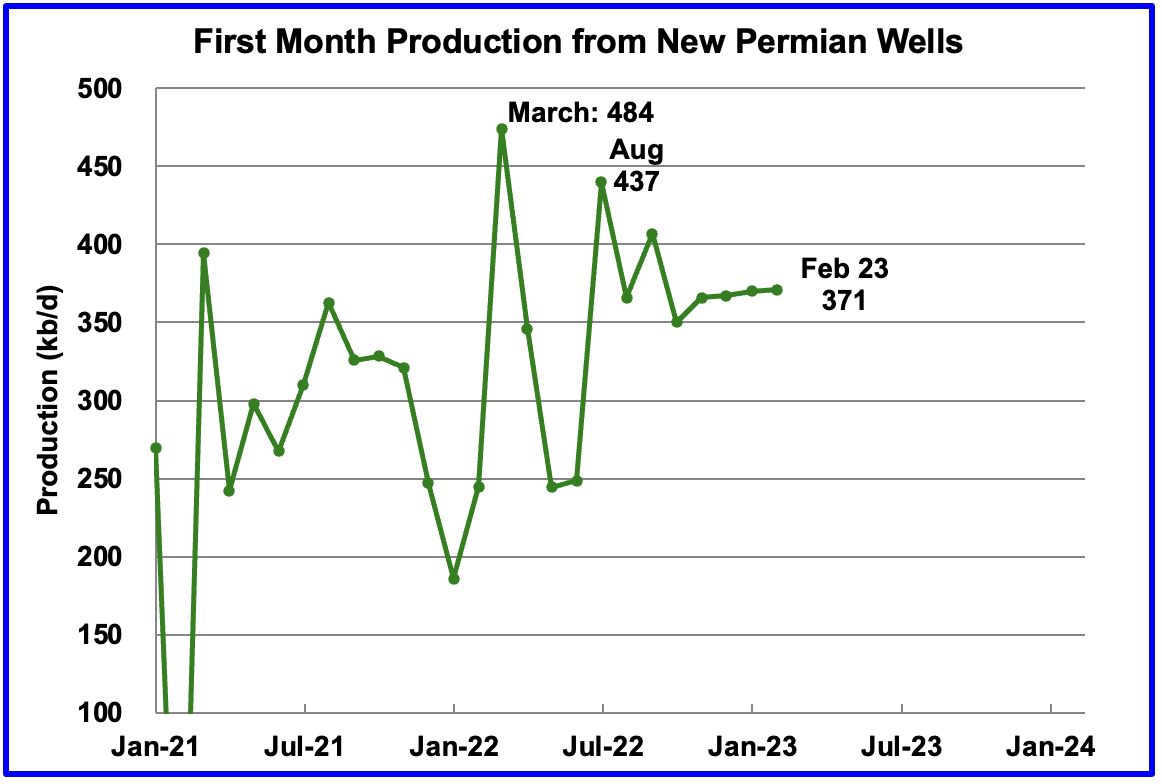
This chart shows the average first month total production from Permian wells tracked on a monthly basis. Since September 2022, the volatility shown in prior months has been reduced. Assuming the latest information is correct, total monthly production from the newest Permian wells in February may have stabilized around the 371 kb/d level. Part of the flat production shown is related to an essentially unchanging number of wells being completed, currently hovering slightly over 430 for the last 4 months.
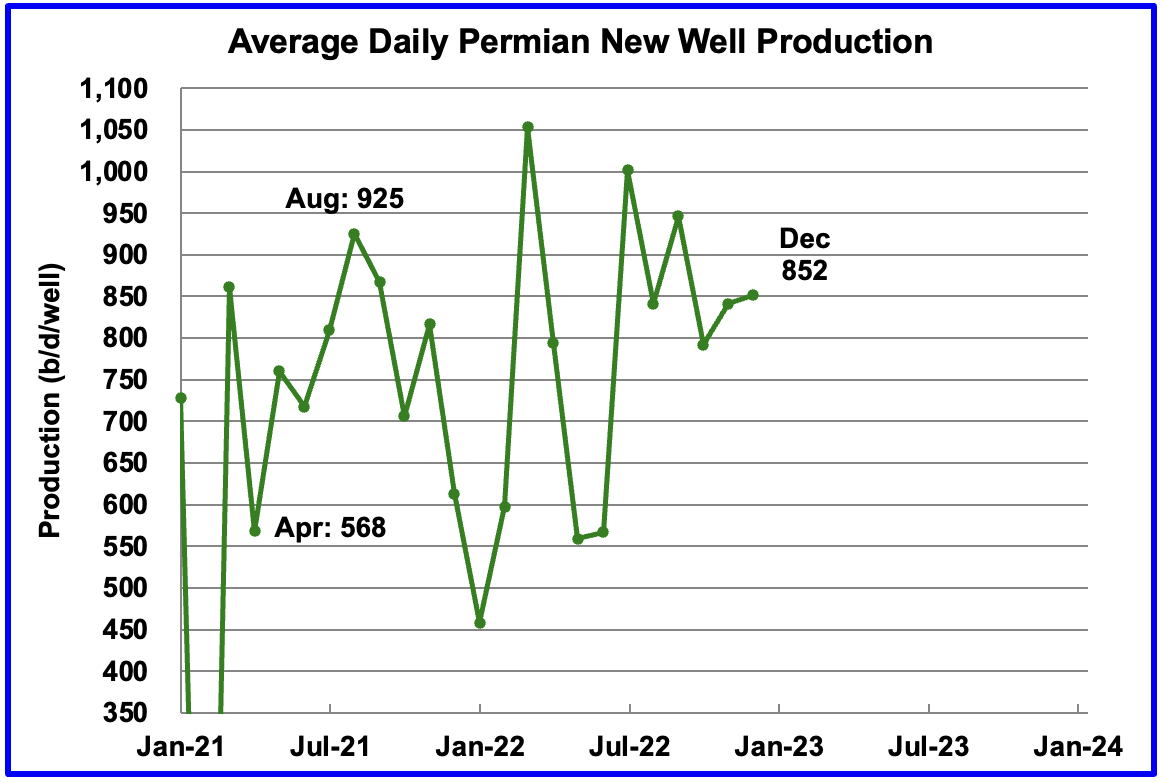
Average daily production for first month Permian wells also shows reduced volatility and indicates average production was 852 b/d in December and could be stabilizing in the 850 kb/d range. Note that December is the latest month for reported completion data.
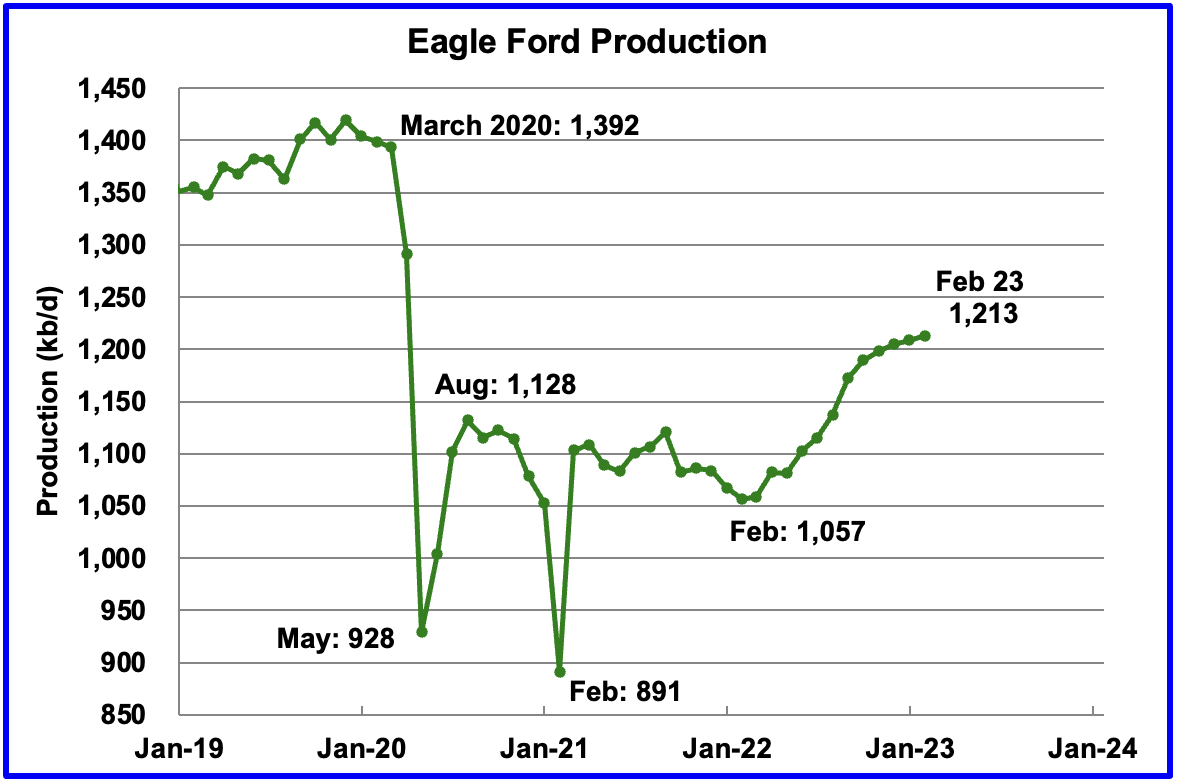
Output in the Eagle Ford basin has been showing an increasing trend since March 2022. More recent data indicates that it may be transitioning to a plateauing phase. For February, output is expected to increase by 4 kb/d to 1,213 kb/d.
At the beginning of the year, 43 rigs were operating in the Eagle Ford basin. As of January 2023, 68 were operational.
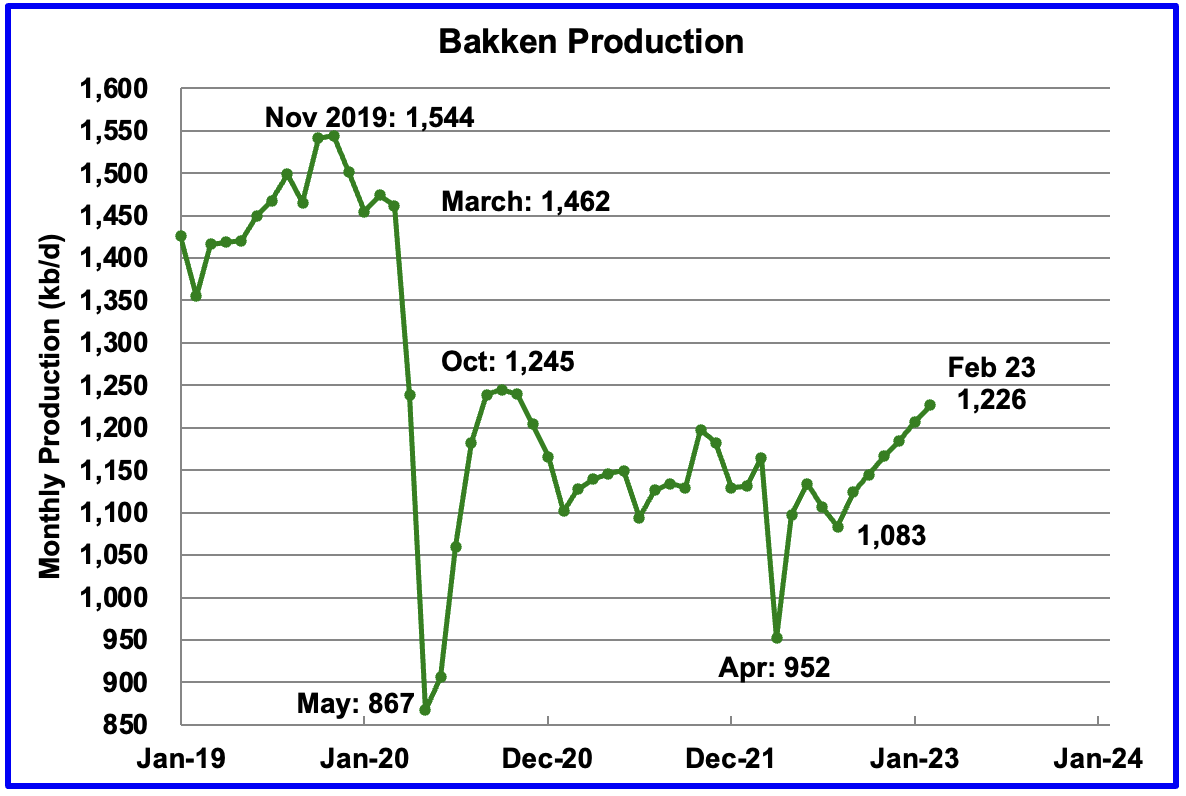
The DPR forecasts Bakken output in February will be 1,226 kb/d an increase of 20 kb/d over January. Production from September onward looks optimistic/wrong considering the extreme weather that North Dakota has experienced recently. The North Dakota Department of Mineral Resources reported that November production was 1,098 kb/d, see next chart, while the DPR is reporting 1,166 kb/d for November.
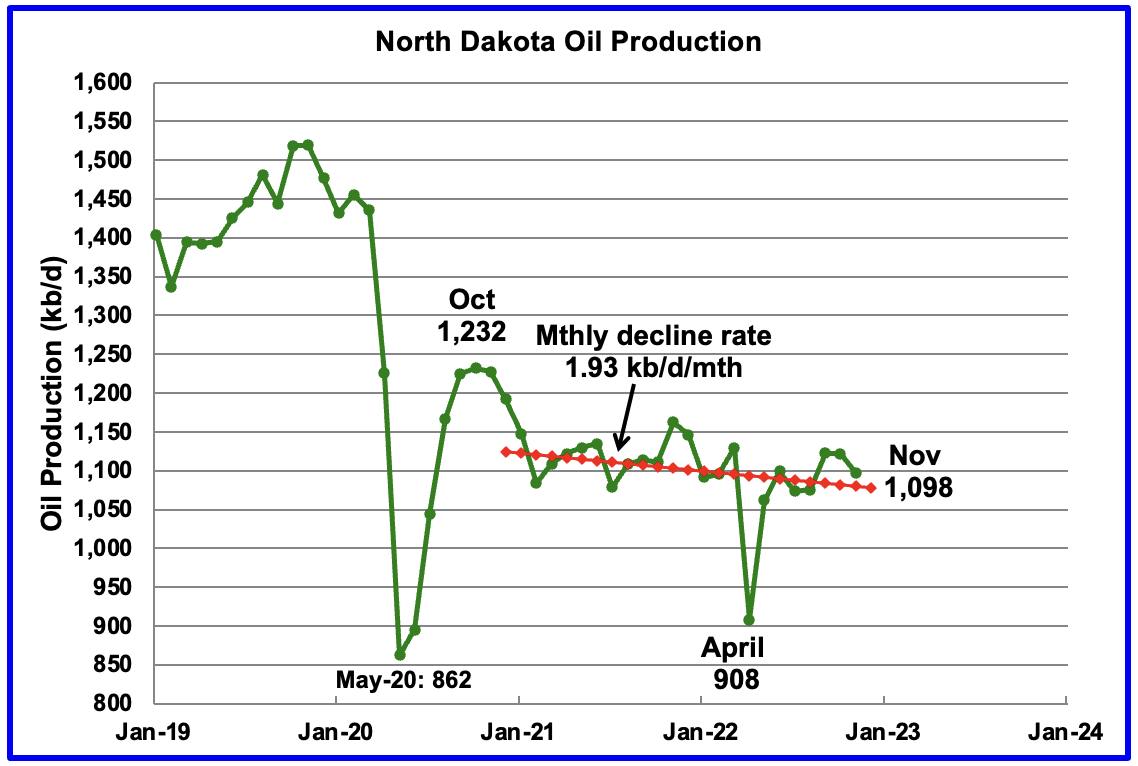
North Dakota production as reported by the Department of Mineral Resources. November production was down by 24 kb/d.
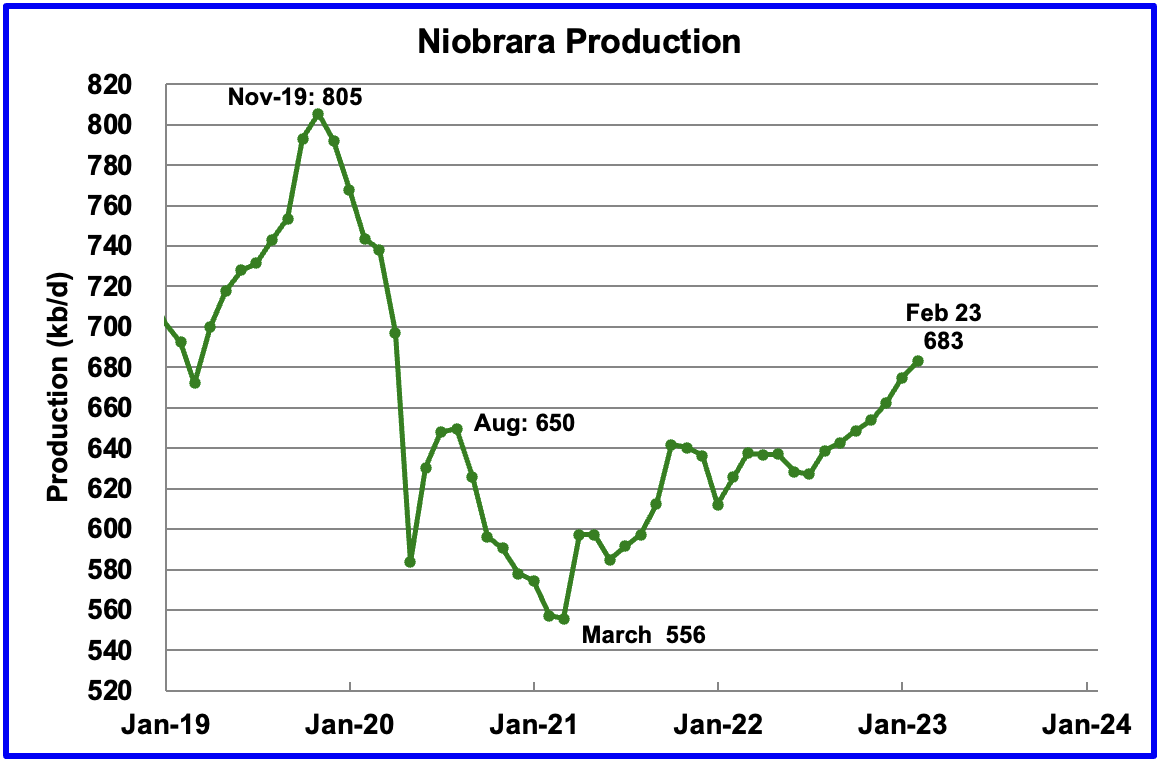
Output in the Niobrara continues to increase slowly. February output increased by 8 kb/d and set a post pandemic high of 683 kb/d.
Production increased due to the addition of more rigs into the basin. The Niobrara had 12 rigs operating in January 2022. By November 2022, the count had increase to 19.
Completions also increased. In January 2022, 73 wells were completed. By November 2022, monthly completions increased to 109, which accounts for the increasing production.
DUCs and Drilled Wells
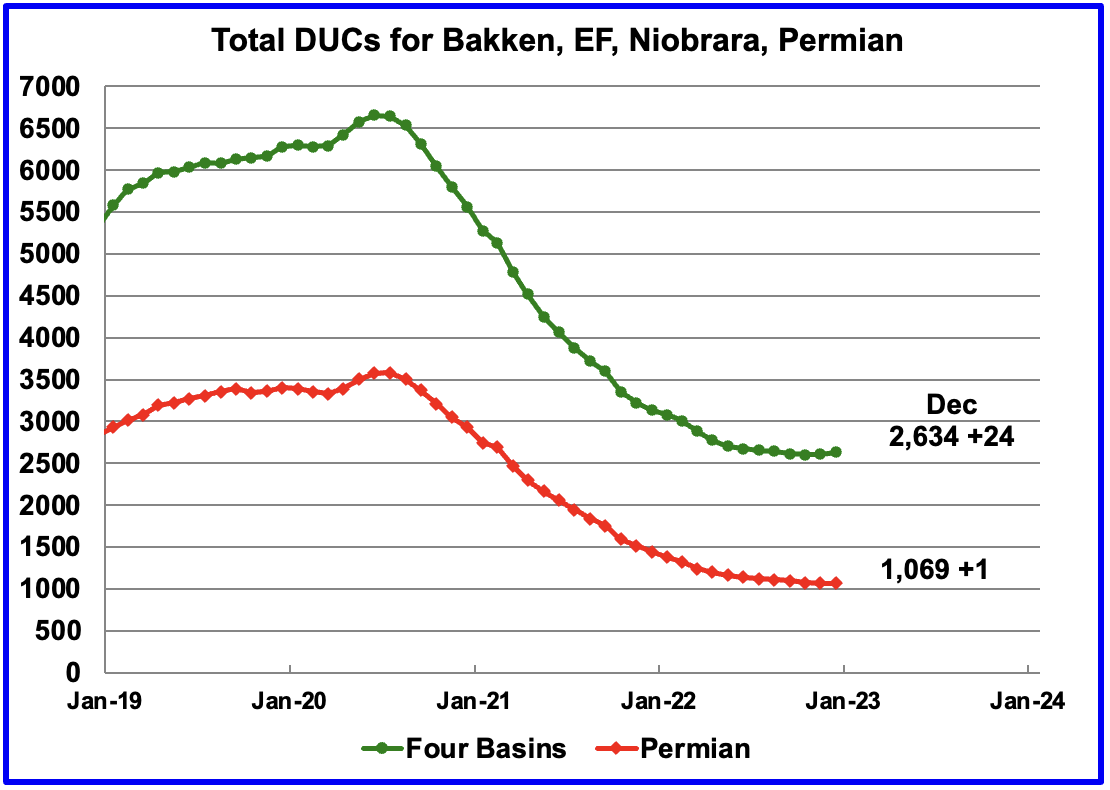
The number of DUCs available for completion in the Permian and the four major DPR oil basins has fallen every month since July 2020 but that trend has now reversed. In November 2022 the trend for total DUCs changed from decreasing to increasing. December added 24 DUCs.
In the Permian, the falling trend in DUCs also changed. December is the first month since mid 2020 when the number of DUCs increased. December Permian DUCs increased by 1 to 1,069 because 432 wells were drilled and 431 were completed.
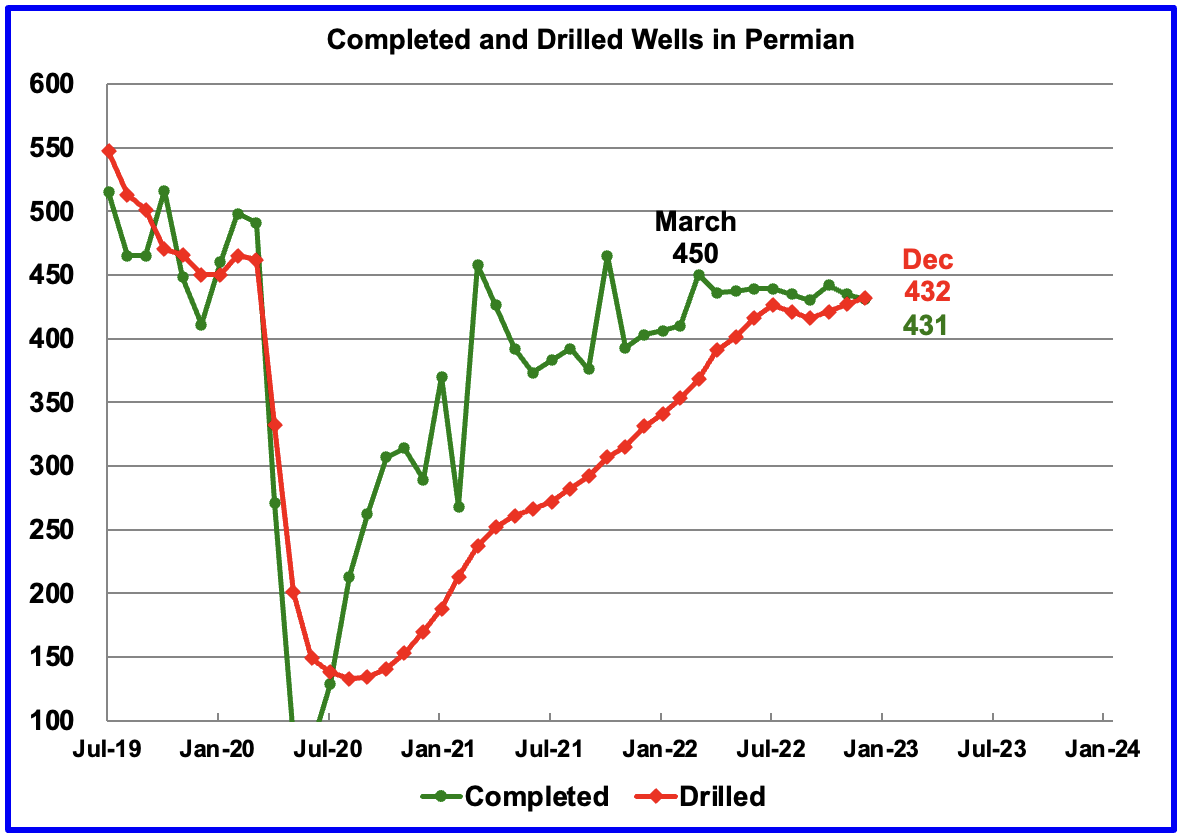
In the Permian, the monthly completion rate has been showing signs of slowing since the March high of 450. This is consistent with the frac spread chart shown above where there has been little to no growth in frac spreads since February. Also the number of wells drilled in the Permian has been essentially flat since July at close to 430.
In December 431 wells were completed, 4 fewer than in December and 19 fewer than in March. During December, 432 new wells were drilled, an increase of 5 over November. The gap between drilled and completed wells in the Permian has now essentially vanished. This raises a question. Since the producers would be completing the best wells, does this imply that most of the remaining 1,065 Permian DUCs are Dead DUCs?
December Light Tight Oil Update
The EIA’s LTO database provides information on LTO production from seven tight oil basins and a few smaller ones. The January 2022 report updates tight oil production to December 2022.
This is the fifth LTO report published since it was updated due operational issues. The current update has made minimal changes to production reported in the previous report.
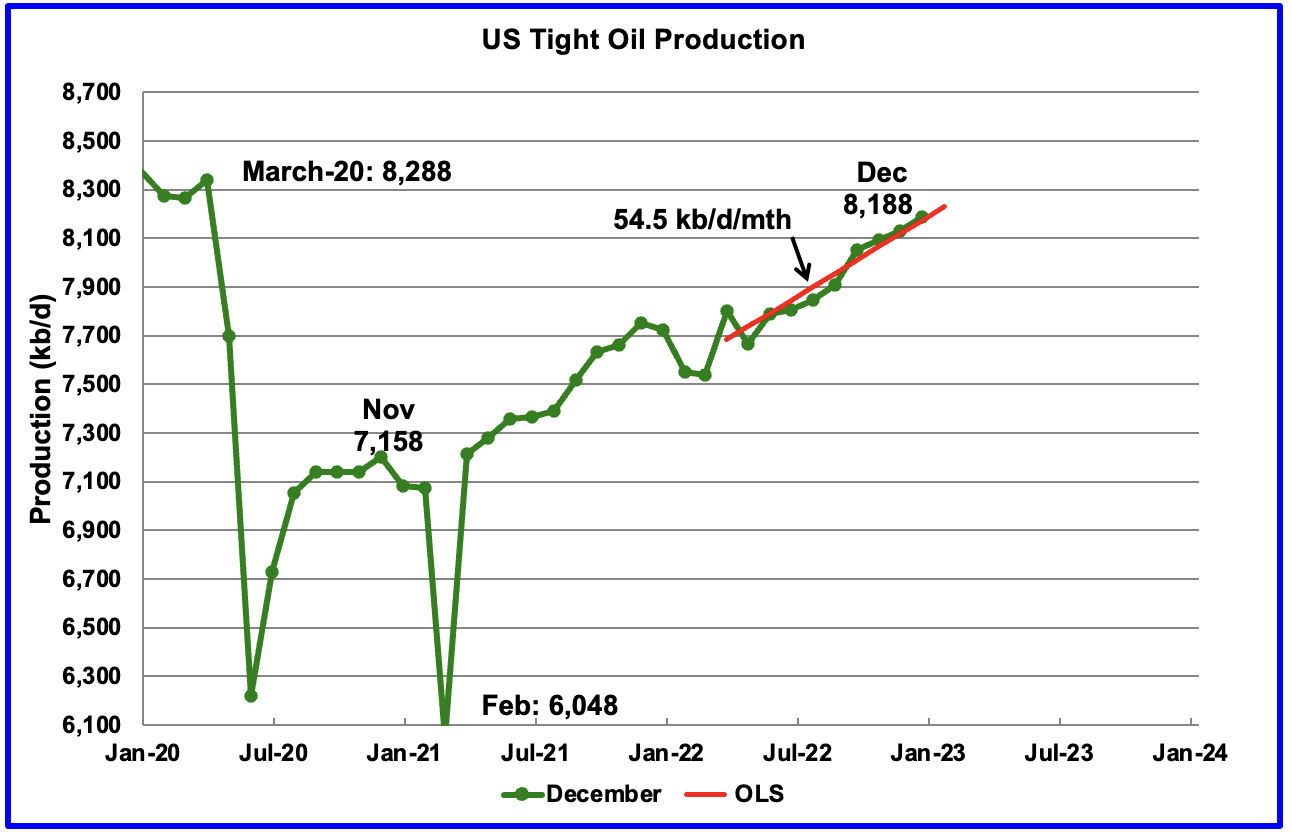
According to the latest LTO report, December’s LTO output increased by 58 kb/d to 8,188 kb/d.
The red OLS line from March 2022 to December 2023 indicates a monthly production increase of 54.5 kb/d/mth.
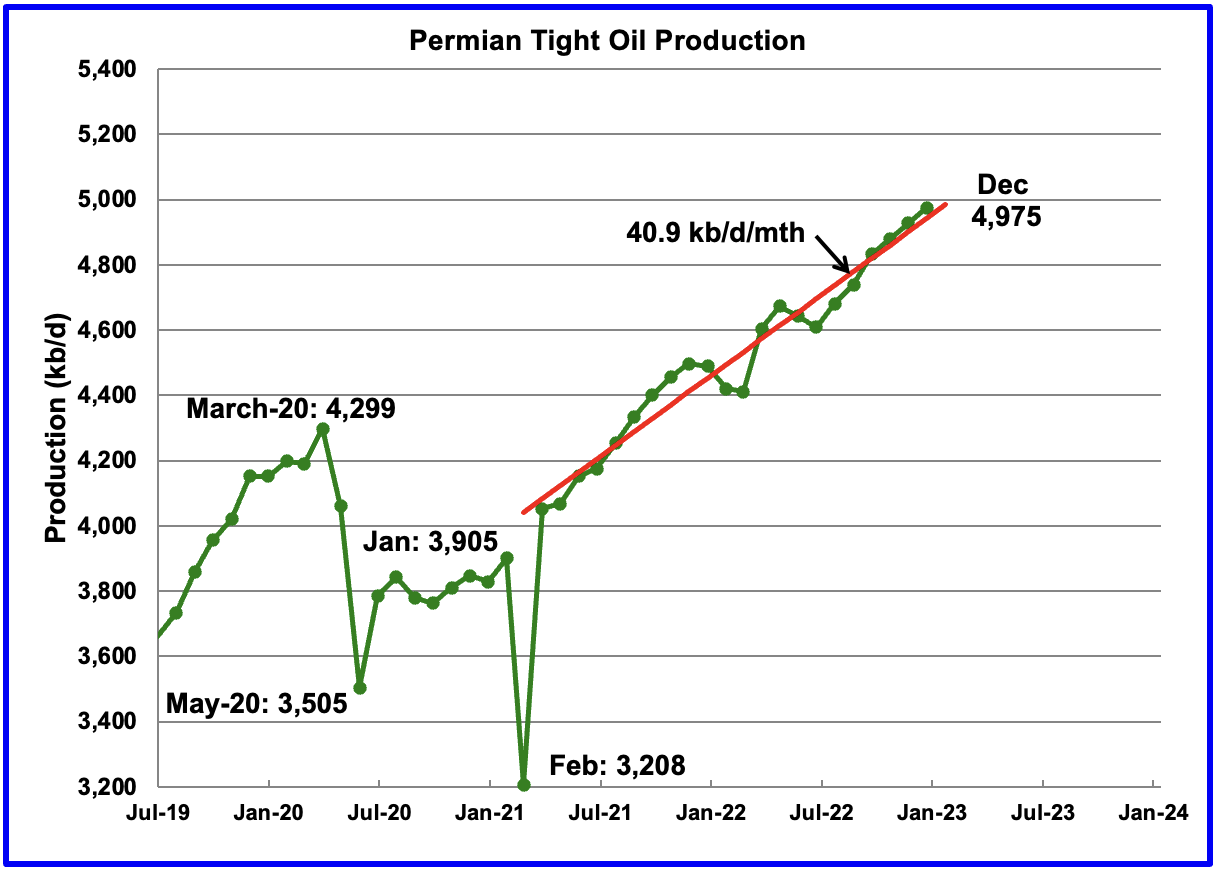
December’s output increased by 48 kb/d to 4,975 kb/d and is 676 kb/d higher than the high of 4,299 kb/d recorded in March 2020.
The monthly production increments for the last three months are close to 47.5 kb/d/mth and appear to be slightly larger than the average slope from March 2021. Over the last 3 months, completions were close to 432/mth and may account to the roughly consistent monthly production increases.
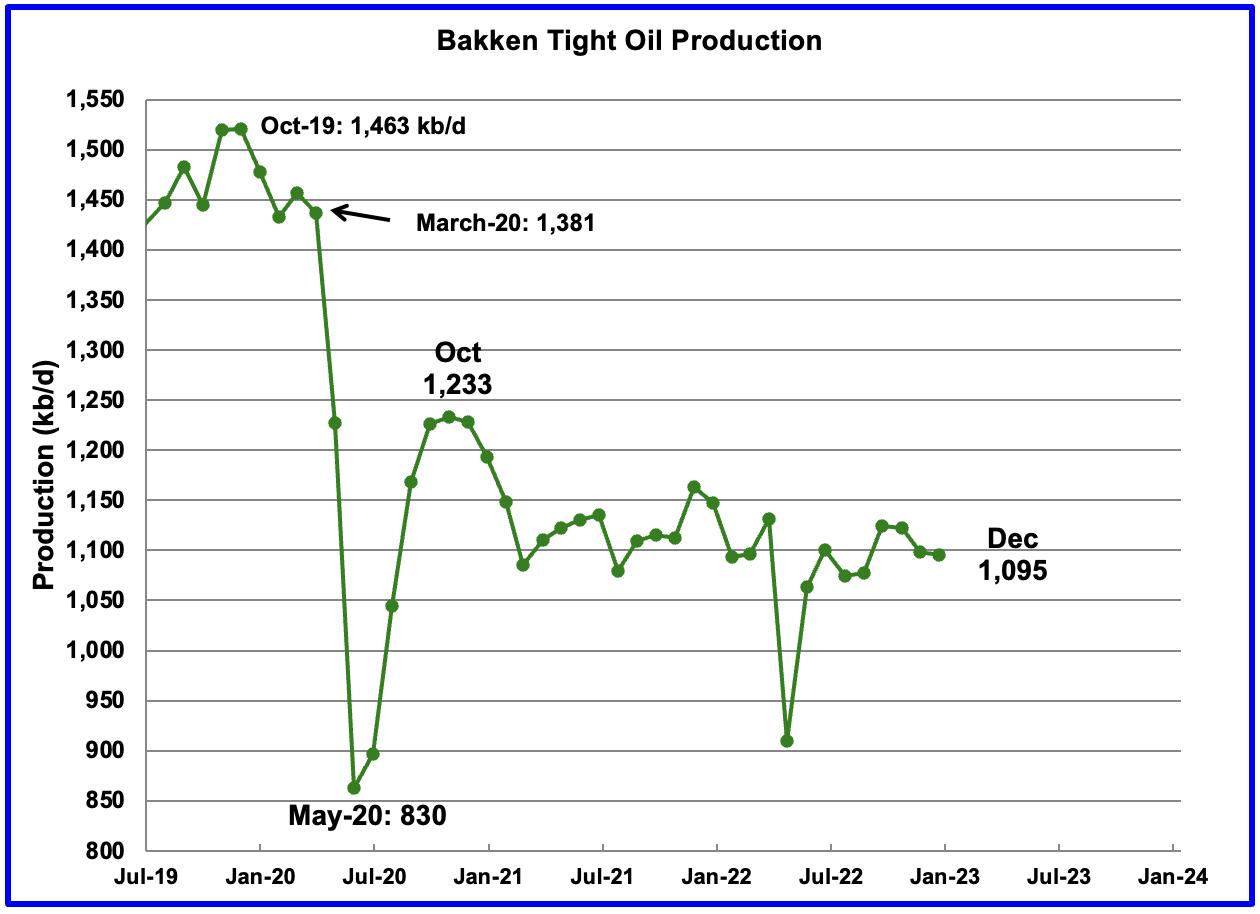
The Bakken’s December LTO output decreased by 4 kb/d to 1,095 kb/d. For comparison, note the DPR Bakken report above, December production increased by 19 kb/d and increased steadily from August to February which is inconsistent with this LTO report. The North Dakota Department of Mineral Resources reported that November production was 1,098 kb/d which is consistent with the LTO report.
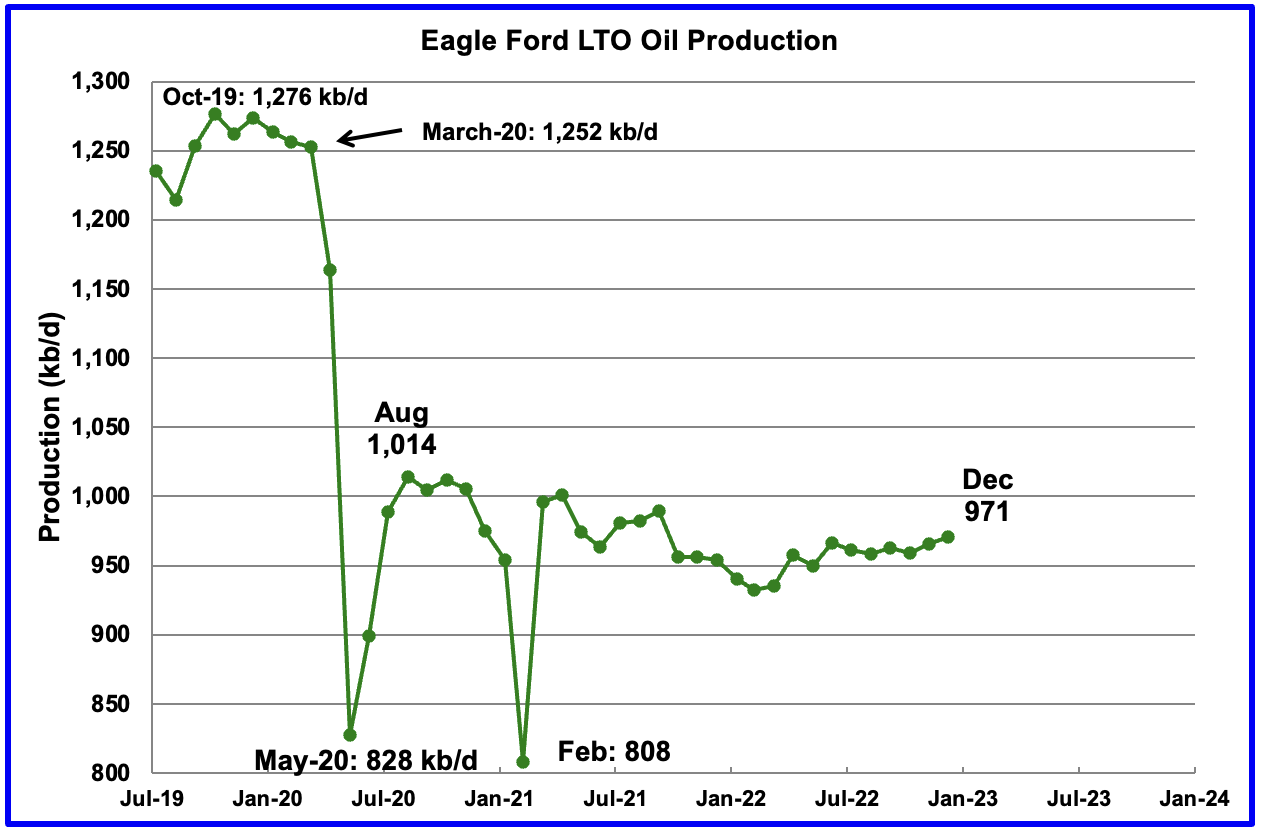
Production in the Eagle Ford basin increased by 5 kb/d in November to 971 kb/d and is little changed from June 2022.
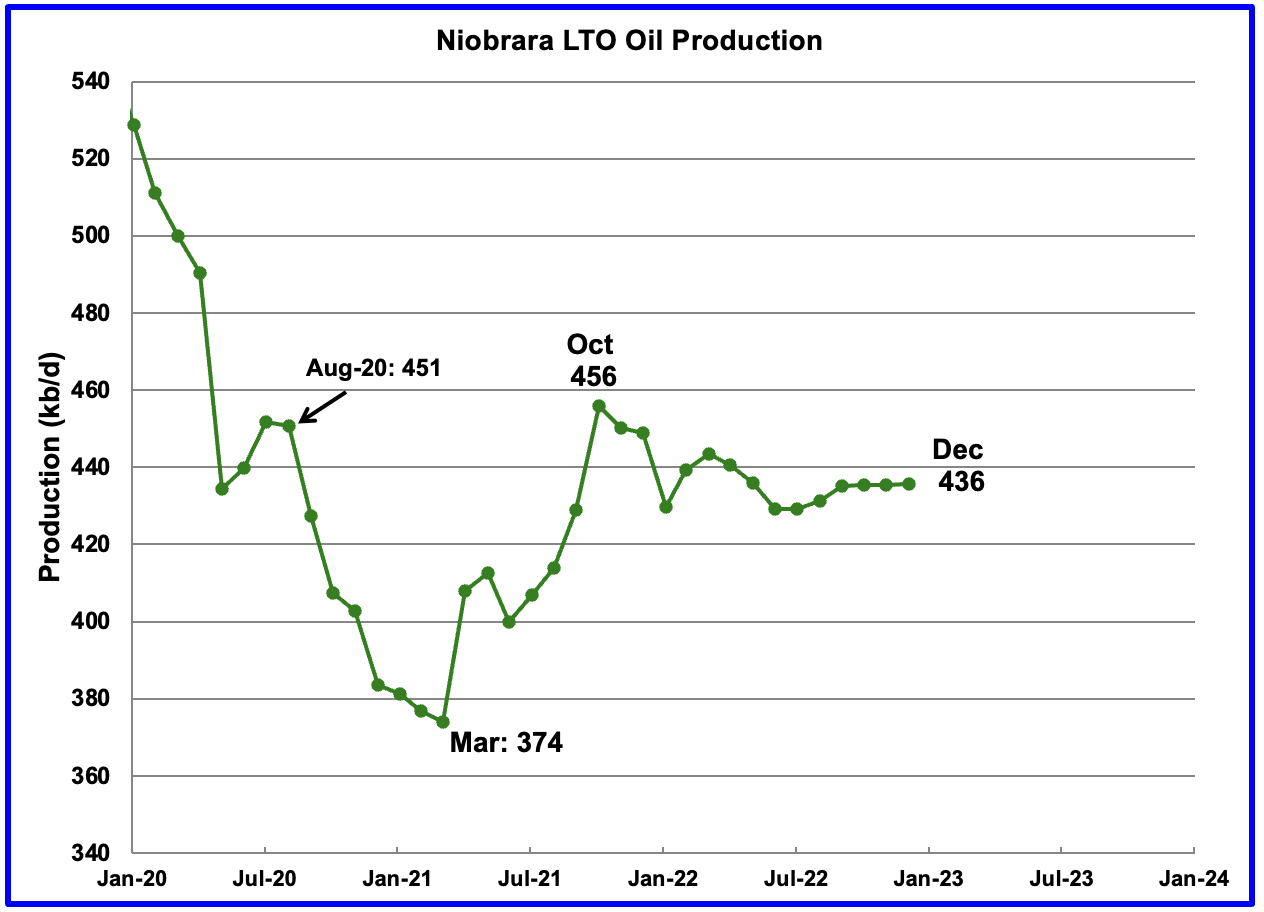
Production in the Niobrara since September has shown little growth. December’s output increased by 1 kb/d to 436 kb/d and has been essentially flat for the past four months. In late October, 19 rigs were operating in the Niobrara basin. In late December and all of January, the number of operational rigs had fallen back to 15.5.
Onshore L48 Conventional Production
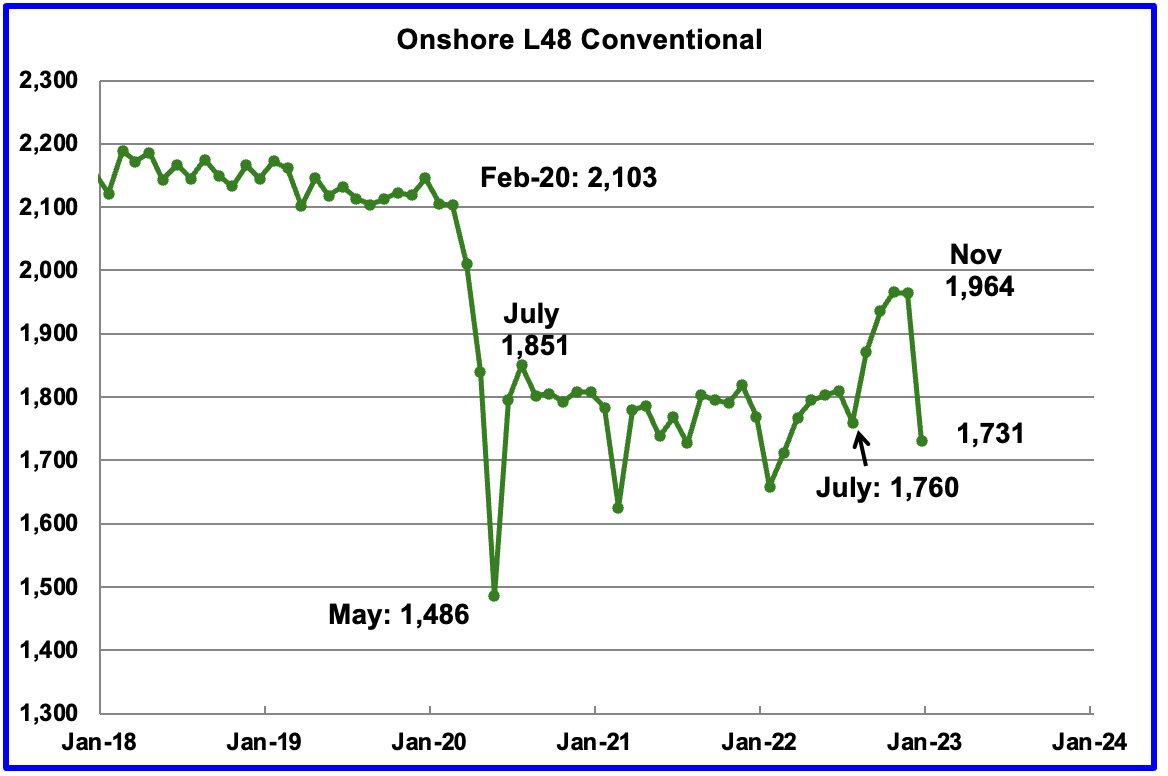
Conventional oil output in the Onshore L48 dropped by 233 kb/d in December to 1,731 kb/d and is more in line with estimates prior to July 2022. This estimate is based on a combination of the expected December LTO output and the January 2023 STEO report that has a December 2022 forecast for the US Onshore L48 output.
The big production drop of 233 kb/d is due to a 175 kb/d November to December drop forecast in the January STEO and a 58 kb/d increase in LTO output. Note that the conventional oil estimate comes from subtracting two large numbers and is quite volatile month to month due to revisions.